Polkadot (DOT/USDT) at the Turning Point: A Reversal or Relief?
Estimated Reading Time: 3 minutes
Don’t invest unless you’re prepared to lose all the money you invest. This is a high-risk investment and you are unlikely to be protected if something goes wrong. Take 2 minutes to learn more
DOTUSDT Long-term Analysis: Ranging
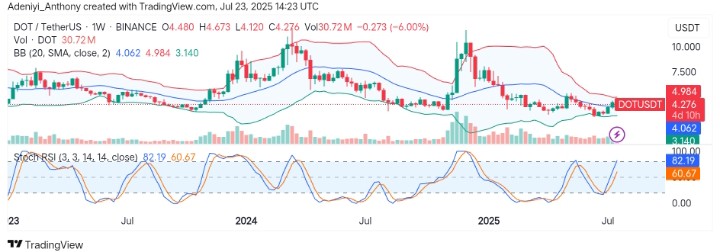
The current market situation around Polkadot against Tether on the weekly chart currently leans toward cautious optimism. However, after months of persistent downtrend and low volatility, the recent price activity shows early signs of a potential recovery. Volume has remained steady, and price is pushing up from the lower Bollinger Band region.
Recently, with the little uptick in price, the Stochastic RSI is entering the overbought territory, signaling early bullish strength, though it needs confirmation from price structure and volume continuation.
To this end, Polkadot trades at $4.261 with a growing participation of over 30 million for the week.
Technical Indicators
Major Resistance Levels: $4.756, $5.700, and $6.500
Major Support Levels: $4.070, $3.130, and $2.800
Polkadot Technical Analysis
On the weekly timeframe, Polkadot has formed a rounding bottom near $3.130 and has broken above the mid-line of the Bollinger Band, indicating the early phase of a possible trend change. However, the Bollinger Bands are starting to widen, suggesting an increase in volatility as the stochastic RSI shows strong upward momentum.
As it stands, if the volume continues to increase, the pair may extend towards $4.756 before experiencing a slight pullback.
DOT/USDT Analysis: A Continued Uptrend or Slight Reversal?
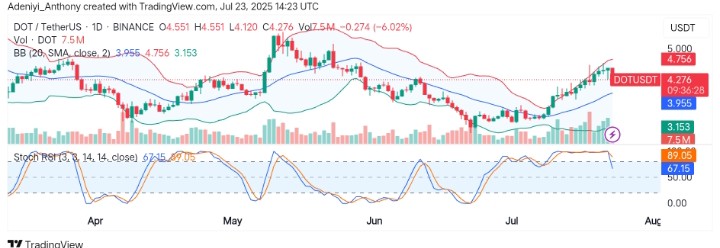
The analysis of DOT/USDT on the daily chart confirms the tone inherent in the weekly timeframe, as price is trending strongly above the 20-day moving average and pushing against the upper Bollinger Band. However, the volume is gradually increasing, supporting the upward momentum. Still, the Stochastic RSI is deep in the overbought zone with a slight bend to the south, signaling a short-term exhaustion.
To this end, as long as the price holds above $4.200, bulls remain in control. However, a daily close above $4.800 could unlock further movement towards the north.
You can purchase crypto coins here. Buy LBlock