Polkadot (DOT/USDT) Attempts Reversal Amid Bollinger Band Squeeze
Estimated Reading Time: 3 minutes
Don’t invest unless you’re prepared to lose all the money you invest. This is a high-risk investment and you are unlikely to be protected if something goes wrong. Take 2 minutes to learn more
Polkadot Long-term Analysis: Ranging
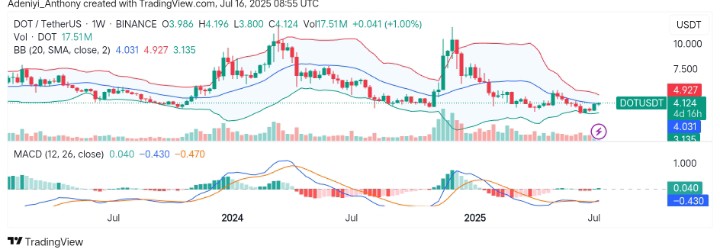
The market for Polkadot against the Tether has been stuck in a sideways trend for several weeks, showing signs of weakness after dropping from its $11 peak at the beginning of the year. However, the pair is beginning to show early signs of a possible recovery on the weekly timeframe, as the pair prepares to stabilize above the mid-dynamic band with a small green candle forming near support.
As it stands, the market condition appears to be cautiously bullish. However, the overall trend remains down as buyers see the MACD histogram flip slightly green, indicating momentum could shift to the upside.
Currently, Polkadot trades at $4.124 with over 17 million traded volumes for the week.
Technical Indicators
Major Resistance Levels: $4.930, $5.500, and $6.800
Major Support Levels: $4.030, $3.130, and $2.600
Polkadot Technical Analysis
On the weekly timeframe, Polkadot against the Tether appears to be rising above the $4.031 dynamic level with the aim of reaching the next resistance at $4.930. However, the squeezing Bollinger Bands indicate the current move might be an early one as participation increases significantly.
From another angle, the MACD seems to be approaching a bullish cross, suggesting the current level might be a nice entry point for more bulls.
To this end, breaking the $4.170 would indicate a move towards $4.930 and beyond; otherwise, oscillation might continue.
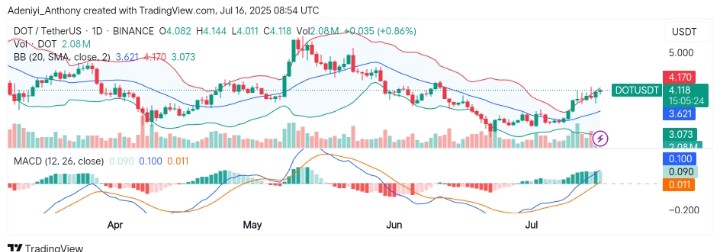
DOT/USDT Analysis: Testing the Limit
On the daily chart, DOT/USDT has continued its short-term bullish move with the price trading above the upper limit. However, the candles are forming higher highs, showing strong buyer momentum in the near term.
On the other hand, the MACD lines have made a clean bullish crossover and are rising above the signal line with increasing green histogram bars, with the volume rising gradually. This confirms that an uptrend is supported by buyer participation.
To this end, the $4.170 is the next hurdle, which may act as a temporary resistance zone. If DOT breaks and closes above $4.200, we could see acceleration toward $4.930 in the near term.
You can purchase crypto coins here. Buy LBlock