BNB Resumes Its Slide After Encountering the $500 Resistance
Estimated Reading Time: 2 minutes
Don’t invest unless you’re prepared to lose all the money you invest. This is a high-risk investment and you are unlikely to be protected if something goes wrong. Take 2 minutes to learn more
BNB (BNB) Long-Term Analysis: Bearish
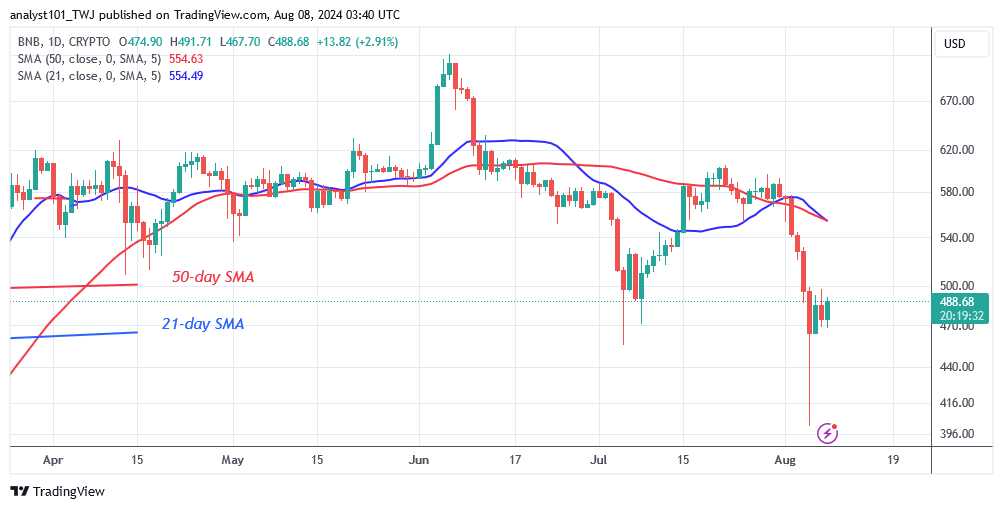
BNB’s price dropped below the moving average lines after encountering the $500 resistance. Bulls bought the dips and resumed their range-bound move, above the $460 support but below the $500 resistance. The altcoin has fluctuated in a limited range over the last three days as the trend is being determined. According to the price indicator, BNB is expected to decline to the downside.
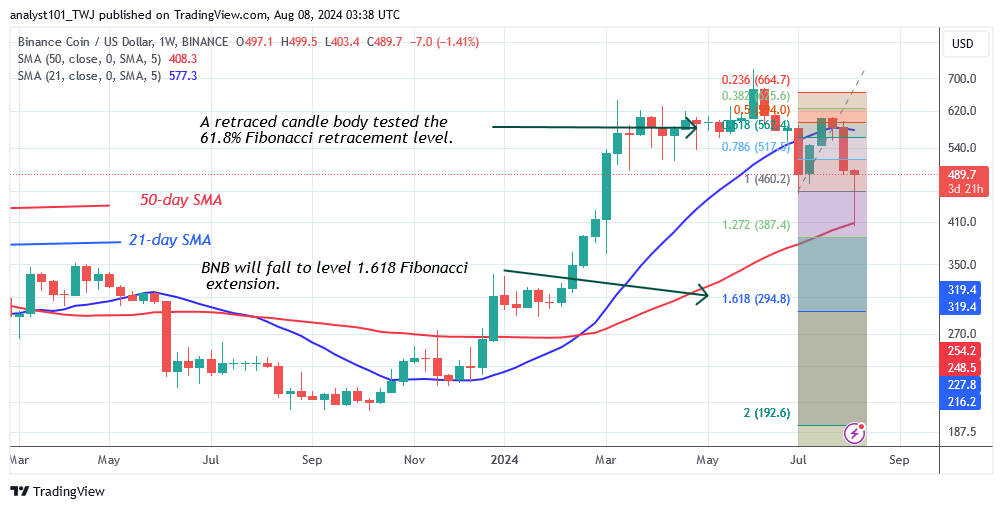
On July 8, the altcoin corrected upward, with a retraced candle body retesting the 61.8% Fibonacci retracement line. BNB is likely to tumble as a result of the upward adjustment. On the downside, if the bears breach the 50-day SMA, BNB will fall to the 1.618 Fibonacci extension, or $294.80. In the meantime, BNB trades between the moving average lines, or between $400 and $500.
BNB (BNB) Indicator Analysis – The $500 Resistance
On the weekly chart, BNB has become caught between the moving average lines. BNB will trade within its range until the moving lines are broken. The BNB price will tumble if the bears break the 50-day SMA support. The drop will continue until level 1.618 Fibonacci extension.
What Is the Next Direction for BNB (BNB)?
The selling pressure on BNB has lessened after encountering the $500 resistance. BNB prices range between $460 to $500. The altcoin’s price has stayed stable as it sits above the $460 support level. The cryptocurrency signal is unfavorable, with bears threatening to drive the price down. Further upward movement is repelled at the $500 high.
You can purchase Lucky Block here. Buy LBLOCK
Note: Cryptosignals.org is not a financial advisor. Do Research before investing your funds in any financial asset or presented product or event. We are not responsible for your investing results.