BNB Trades In A Range As It Faces The $635 Obstacle
Estimated Reading Time: 2 minutes
Don’t invest unless you’re prepared to lose all the money you invest. This is a high-risk investment and you are unlikely to be protected if something goes wrong. Take 2 minutes to learn more

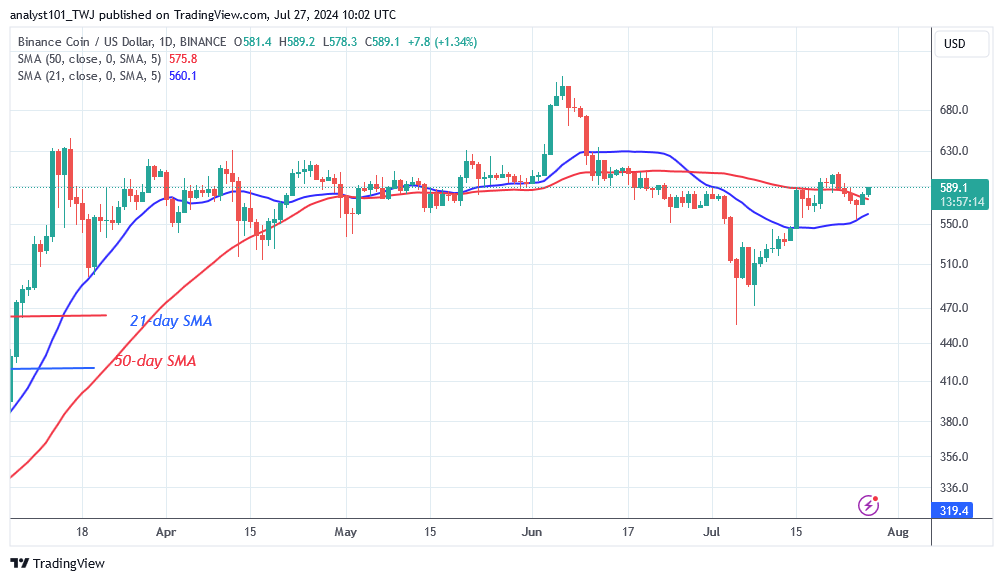
BNB (BNB) Long-Term Analysis: Bullish
BNB’s price has risen above the 50-day SMA as it faces the $635 obstacle. BNB broke above the 21-day SMA resistance on July 15, and it is currently trading in a range of $560 to $635. On July 26, buyers pushed the price above the 50-day SMA, signaling the start of an upward trend. Buyers plan to propel the altcoin to the next resistance level at $635. On the July 21 rally, the altcoin was rejected after reaching a high of $605.
Today, bullish momentum has begun as bulls aim to break through the resistance at $635. If the bulls overcome the $635 level, the bullish momentum will continue to $724. However, a rejection at the $635 resistance level will cause the altcoin to continue its sideways trend. BNB will trade above $560 but below $635.
Technical indicators:
Major Resistance Levels – $600, $660, $720
Major Support Levels – $400, $340, $280
BNB (BNB) Indicator Analysis
On July 26, the breakout prompted the price bars to rise above the moving average lines. BNB will increase because it is in the positive trend zone. The moving average lines have remained horizontal due to the upward correction. If the upward correction continues, the moving average lines will cross in a bullish pattern.
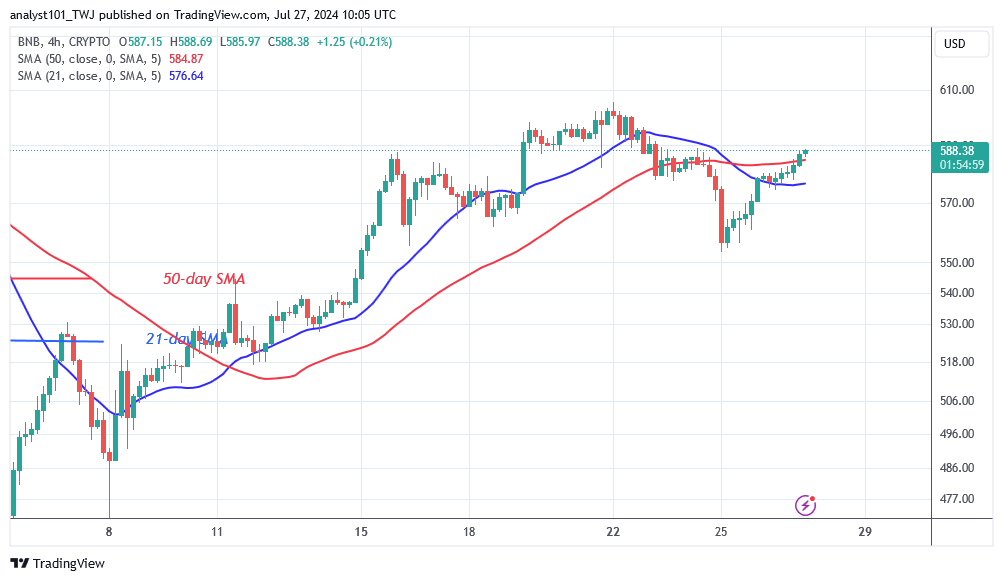
What Is the Next Direction for BNB (BNB)?
On July 26, BNB recovered above the moving average lines as it faced the $635 obstacle. Buyers are sending the altcoin to its previous high of $635. On the 4-hour chart, the bullish momentum has stopped near the $605 high. BNB is increasing as it approaches the resistance at $605. If the $635 resistance level is not broken, the market will be forced to trade in a range. Meanwhile, the crypto signal is bullish as it breaks above the 50-day SMA.
You can purchase Lucky Block here. Buy LBLOCK
Note: Cryptosignals.org is not a financial advisor. Do Research before investing your funds in any financial asset or presented product or event. We are not responsible for your investing results.