Ethereum (ETH) Reaches Previous Low, Resumes Uptrend
Estimated Reading Time: 2 minutes
Don’t invest unless you’re prepared to lose all the money you invest. This is a high-risk investment and you are unlikely to be protected if something goes wrong. Take 2 minutes to learn more

Ethereum Price Long-Term Analysis: Bearish
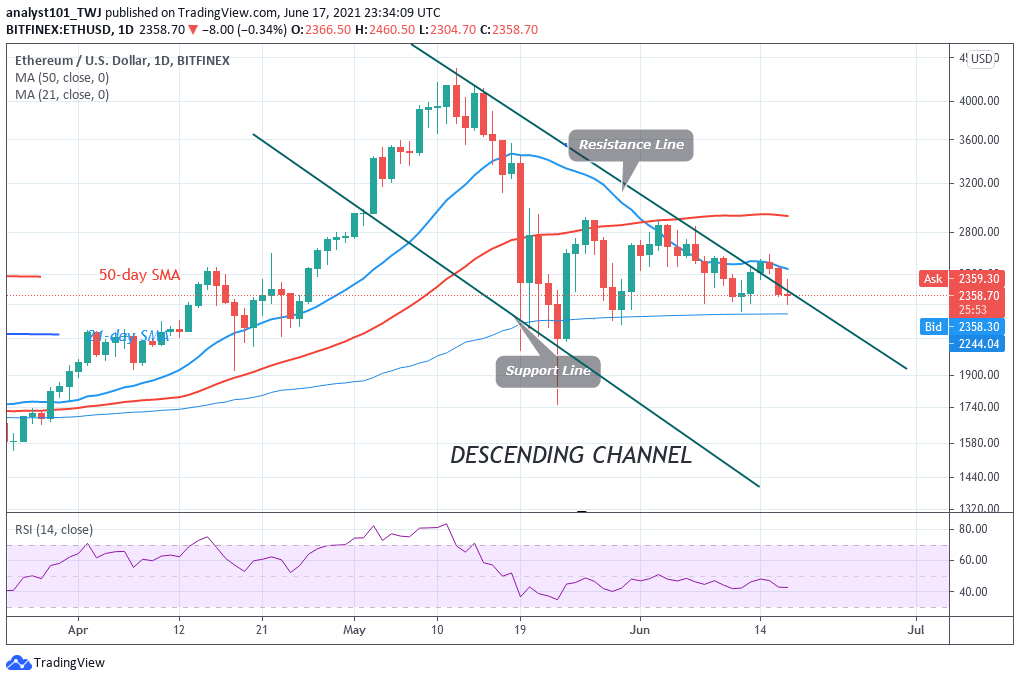
Ethereum has fallen to the previous low at $2,310. This will be the fourth retest at the previous low. Buyers have intended to break the previous lower high at $2,600 on June 15 but were resisted. This compelled the altcoin to retest the previous low at $2,310. Similar rejection on June 9 compelled ETH to revisit the previous low. ETH/USD has reached bearish exhaustion. There is a likelihood for an upward move.
Ethereum Indicator Analysis
Ethereum is below the 20% range of the daily stochastic. It indicates that the market has reached the oversold region of the market. The selling pressure is likely to be exhausted. Buyers are likely to emerge in the oversold region of the market. Ether is at level 42 of the Relative Strength Index period 14. It indicates that Ether is in the downtrend zone and capable of falling on the downside.

Technical indicators:
Major Resistance Levels – $2, 600, $2,800, $3,000
Major Support Levels – $1.500, $1, 300, $1,100
What Is the Next Direction for Ethereum?
The biggest altcoin is consolidating above the previous low at $2,310. According to the Fibonacci tool on June 8 downtrend; a retraced candle body tested the 78.6% Fibonacci retracement level. The retracement indicates that ETH is likely to fall and reverse at level 1.272 Fibonacci extension or $2,316.21.

You can purchase crypto coins here. Buy Tokens
Note: new.cryptosignals.org is not a financial advisor. Do your research before investing your funds in any financial asset or presented product or event. We are not responsible for your investing results