Ripple (XRP) Pushes On the Upside, Targets Level $2.0
Estimated Reading Time: 2 minutes
Don’t invest unless you’re prepared to lose all the money you invest. This is a high-risk investment and you are unlikely to be protected if something goes wrong. Take 2 minutes to learn more
Ripple (XRP) Long-Term Analysis: Bullish
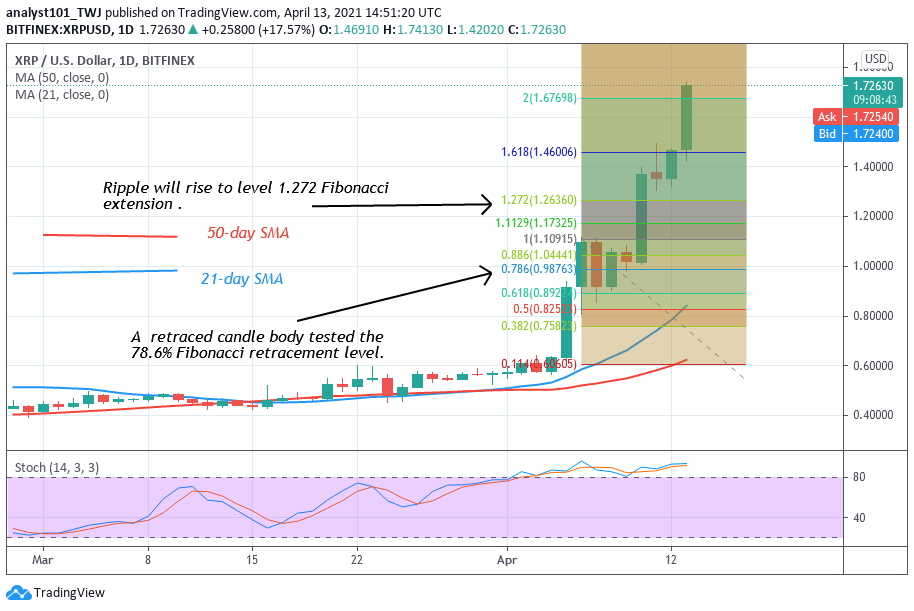
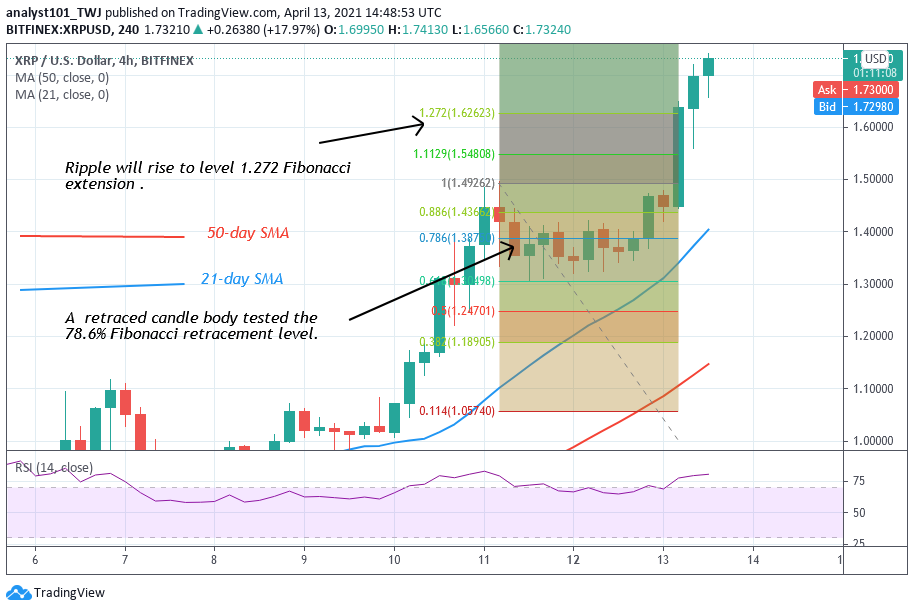
Ripple price continued its rally after it broke through the initial resistance at 1.10. Today, the Ripple price has risen to $1.72 at the time of writing. This recent price surge is expected to reach a high of $2.0. However, price indicators have shown that XRP has reached the overbought region of the market. Meanwhile, on April 6 uptrend; a retraced candle body tested the 78.6% Fibonacci retracement level. The retracement indicates that XRP will rise and reverse at level 1.272 or $1.26. Nevertheless, from the price action, the market has surpassed the targeted price level.
Ripple (XRP) Indicator Analysis
XRP has risen to level 80 of the Relative Strength Index period 14. It indicates that the crypto has reached the overbought region. Also, Sellers are likely to emerge to push prices down. The 21-day SMA and the 50-day SMA are sloping up indicating the uptrend.
Technical indicators:
Major Resistance Levels – $0.90, $0.95, $1.10
Major Support Levels – $0.50, $0.45, $0.40
What Is the Next Direction for Ripple (XRP)?
Ripple has resumed upside momentum after breaking the recent high of $1.10. On the 4 Hour chart, XRP is rising on the upside. On April 11 uptrend; a retraced candle body tested the 78.6% Fibonacci retracement level. This retracement implies that XRP will rise to level 1.272 Fibonacci extensions or the high of $1.62.From the price action, the market has surpassed this level.
Note: cryptosignals.org is not a financial advisor. Do your research before investing your funds in any financial asset or presented product or event. We are not responsible for your investing results