Render Token (RNDRUSD) Achieves Breakthrough Beyond $4.294 Price Threshold
Estimated Reading Time: 3 minutes
Don’t invest unless you’re prepared to lose all the money you invest. This is a high-risk investment and you are unlikely to be protected if something goes wrong. Take 2 minutes to learn more
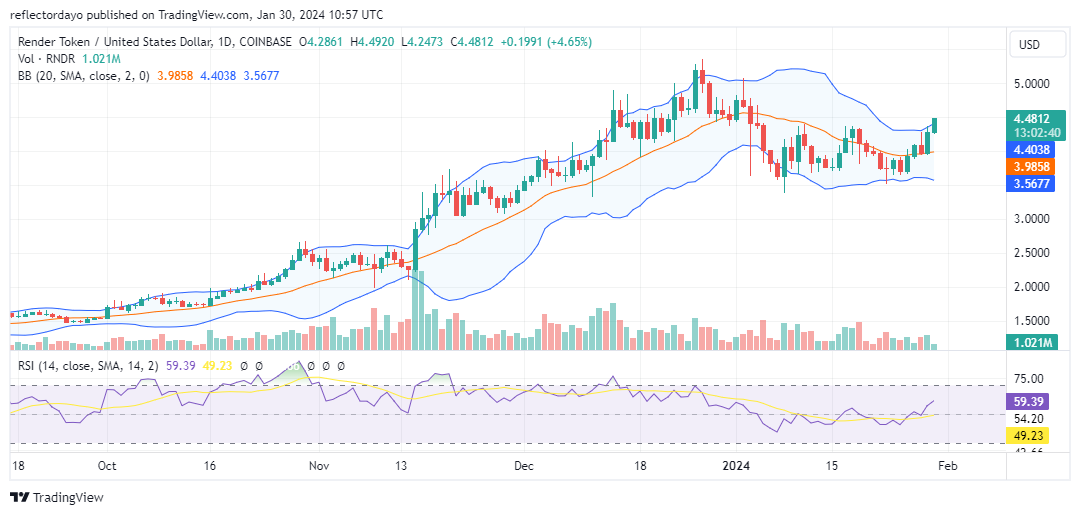
The Render market has recently surpassed the significant $4.294 price level, marking a notable breakthrough. This accomplishment holds the potential to pave the way for a price rally towards the $5.163 level, which acted as a point of rejection for the bull market on December 27 of the previous year. It is noteworthy that the bearish momentum originated from the peak at $5.163, leading to a subsequent decline in the market.
As of January 8, bullish sentiment has established a support level around the $3.66 price point. The ensuing conflict between bullish and bearish sentiments has resulted in a chart formation that presents a crypto signal indicative of market indecision. It is crucial for market participants to closely monitor further developments and consider the evolving dynamics before making informed decisions.
The Render Token Market Data
- RNDR/USD Price Now: $4.49
- RNDR/USD Market Cap: $1,728,474,591
- RNDR/USD Circulating Supply: 376,146,336 RNDR
- RNDR/USD Total Supply: 531,039,933 RNDR
- RNDR/USD CoinMarketCap Ranking: #47
Key Levels
- Resistance: $4.50, $5.00, and $5.40.
- Support: $3.50., $3.00, and $2.25.
The Render Token Market Crypto Signal: Analyzing the Indicators
The intervention of the bulls near the $3.66 support price level has led to the formation of a rectangle consolidation price pattern. In today’s trading session, a bullish breakout has occurred, and the bullish candlestick is particularly noteworthy. However, upon examining the volume of trade indicator, it is observed that the histogram is not as significant as the bullish candlestick itself. This suggests that the ongoing bullish price action may not be entirely sustainable.
Nevertheless, the breach of the $4.294 resistance level has the potential to attract more bullish sentiment, fostering a price rally towards the December 27 high of $5.160. Render traders and investors should exercise caution and closely monitor further market developments to make informed decisions based on evolving dynamics.
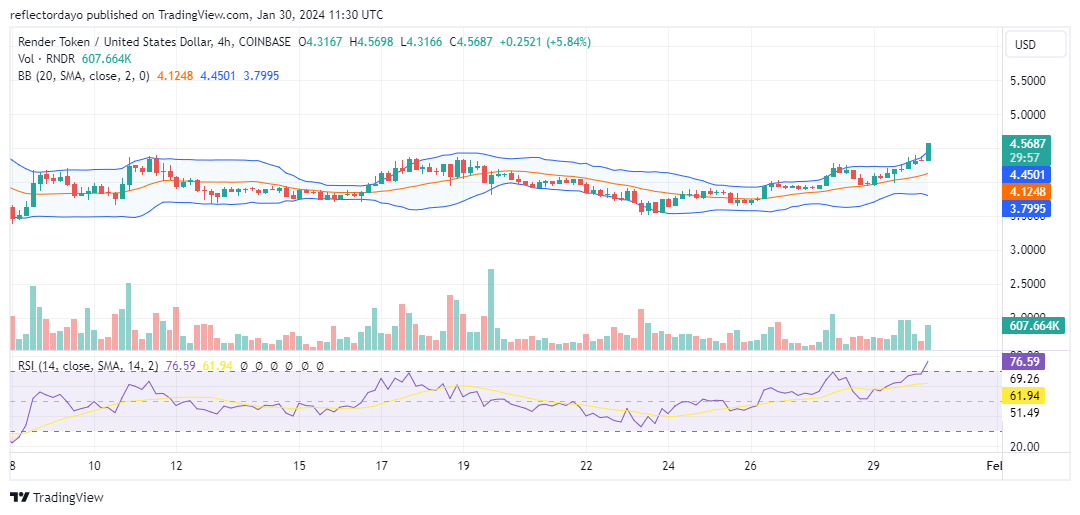
RNDR/USD 4-Hour Chart Outlook
While the daily chart’s volume of trade presented a somewhat discouraging picture due to its divergence from the robust bullish candlestick, the volume of trade observed in the 4-hour chart provides a reassuring perspective, affirming the sustainability of the current bullish momentum. Presently, the market exhibits a price surpassing the $4.500 mark, accompanied by a Marubozu candlestick. This crypto signal strongly indicates a robust bullish market.
However, it is worth noting that the Relative Strength Index (RSI) signals an overbought situation, which might dissuade certain traders from adopting a long position in the market. Despite this consideration, the target remains focused on the December 27 high of $5.160. Traders and investors are advised to carefully assess these indicators and exercise prudent risk management strategies in navigating the evolving market conditions.