The API3 Market (API3/USD) Settles In a Higher Price Range
Estimated Reading Time: 3 minutes
Don’t invest unless you’re prepared to lose all the money you invest. This is a high-risk investment and you are unlikely to be protected if something goes wrong. Take 2 minutes to learn more
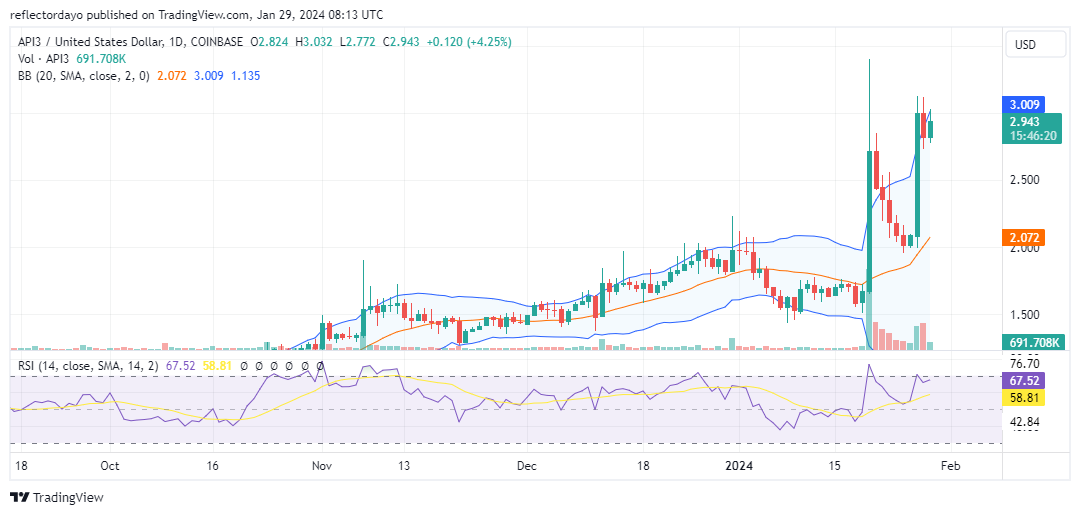
The market has recently exhibited notable upward performance. On January 20, there was a substantial surge in prices, with values reaching as high as $3,400 before initiating a pronounced bearish movement. However, the bulls of the API3 market successfully maintained the prevailing trend by intervening at the $2.00 price level. This represents a higher support level compared to the previous support level, which was at $1.600. Presently, the market demonstrates an elevated support level at $2.800.
The API3 Market Data
- API3/USD Price Now: $2.943
- API3/USD Market Cap: $254,154,561
- API3/USD Circulating Supply: 86,421,978 API3
- API3/USD Total Supply: 125,324,588 API3
- API3/USD CoinMarketCap Ranking: #177
Key Levels
- Resistance: $3.10, $3.20, and $3.25.
- Support: $2.80., $2.60, and $2.40.
API3 Market Crypto Signal: Analyzing the Indicators
The API3 market has recently established a new support level at $2.800. Nevertheless, there is a concentration of bearish traders in close proximity to the $3.00 price level. This market development suggests the potential emergence of a consolidation trend. If this price pattern persists, a rectangle pattern may soon materialize on the chart. The formation of a rectangle pattern typically makes it challenging to anticipate the market’s next direction. Despite the prevailing bullish sentiment, indicated by the Relative Strength Index (RSI) hovering around the overbought region, it is uncertain whether the next move will be in a bearish direction. Alternatively, there is a possibility that the bullish trend may persist, reaching the $3.400 price level.
API3/USD 4-Hour Chart Outlook
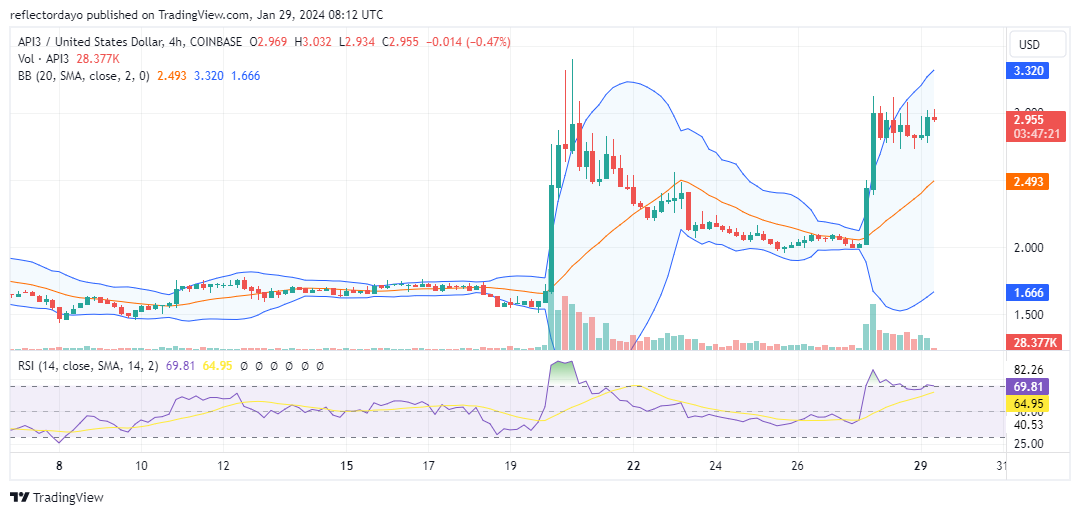
As the API3 market continues to fluctuate between the $2.800 and $3.00 price levels, it becomes apparent that the price has repeatedly tested the $3.00 threshold without surpassing it. This observation suggests a robust resistance from the bearish forces, creating a substantial barrier for the bullish market. Simultaneously, the consistent lower shadows observed at the $2.800 support level indicate a resilient and dependable support level.
The current market dynamics indicate a phase of price consolidation. This trend could be attributed, in part, to the Relative Strength Index (RSI), where the RSI line hovers around the overbought threshold. This crypto signal from the chart raises the possibility that bears might seize the opportunity to drive the market down to lower price levels.