Starknet (STRK/USD) Market Insight: Consolidation Holds as Volume Declines—Bullish Marubozu Signals Potential Shift
Estimated Reading Time: 3 minutes
Don’t invest unless you’re prepared to lose all the money you invest. This is a high-risk investment and you are unlikely to be protected if something goes wrong. Take 2 minutes to learn more
Technically, Starknet (STRK/USD) remains in a consolidation phase, following a series of sessions marked by relatively strong trading volumes that have now started to diminish. This tapering of volume typically points to reduced market participation and a general state of indecision, as traders await clearer directional signals.
Amid this quiet period, today’s bullish Marubozu candlestick introduces a potentially optimistic twist. A Marubozu, particularly on the bullish side, is characterized by a full-bodied candle that closes near its high with little to no wicks—signifying strong intraday buying pressure and decisive control by the bulls. While the price move itself may not have been dramatic, the candle’s formation reflects renewed bullish interest and could hint at a possible breakout attempt, pending confirmation in upcoming sessions.
Starknet Market Data
- STRK/USD Price Now: $0.17
- STRK/USD Market Cap: $543 million
- STRK/USD Circulating Supply: 3 billion STRK
- STRK/USD Total Supply: 10 billion STRK
- STRK/USD CoinMarketCap Ranking: #117
Key Levels
- Resistance: $0.20, $0.21 and $0.22
- Support: $0.15, $0.14, and $0.13
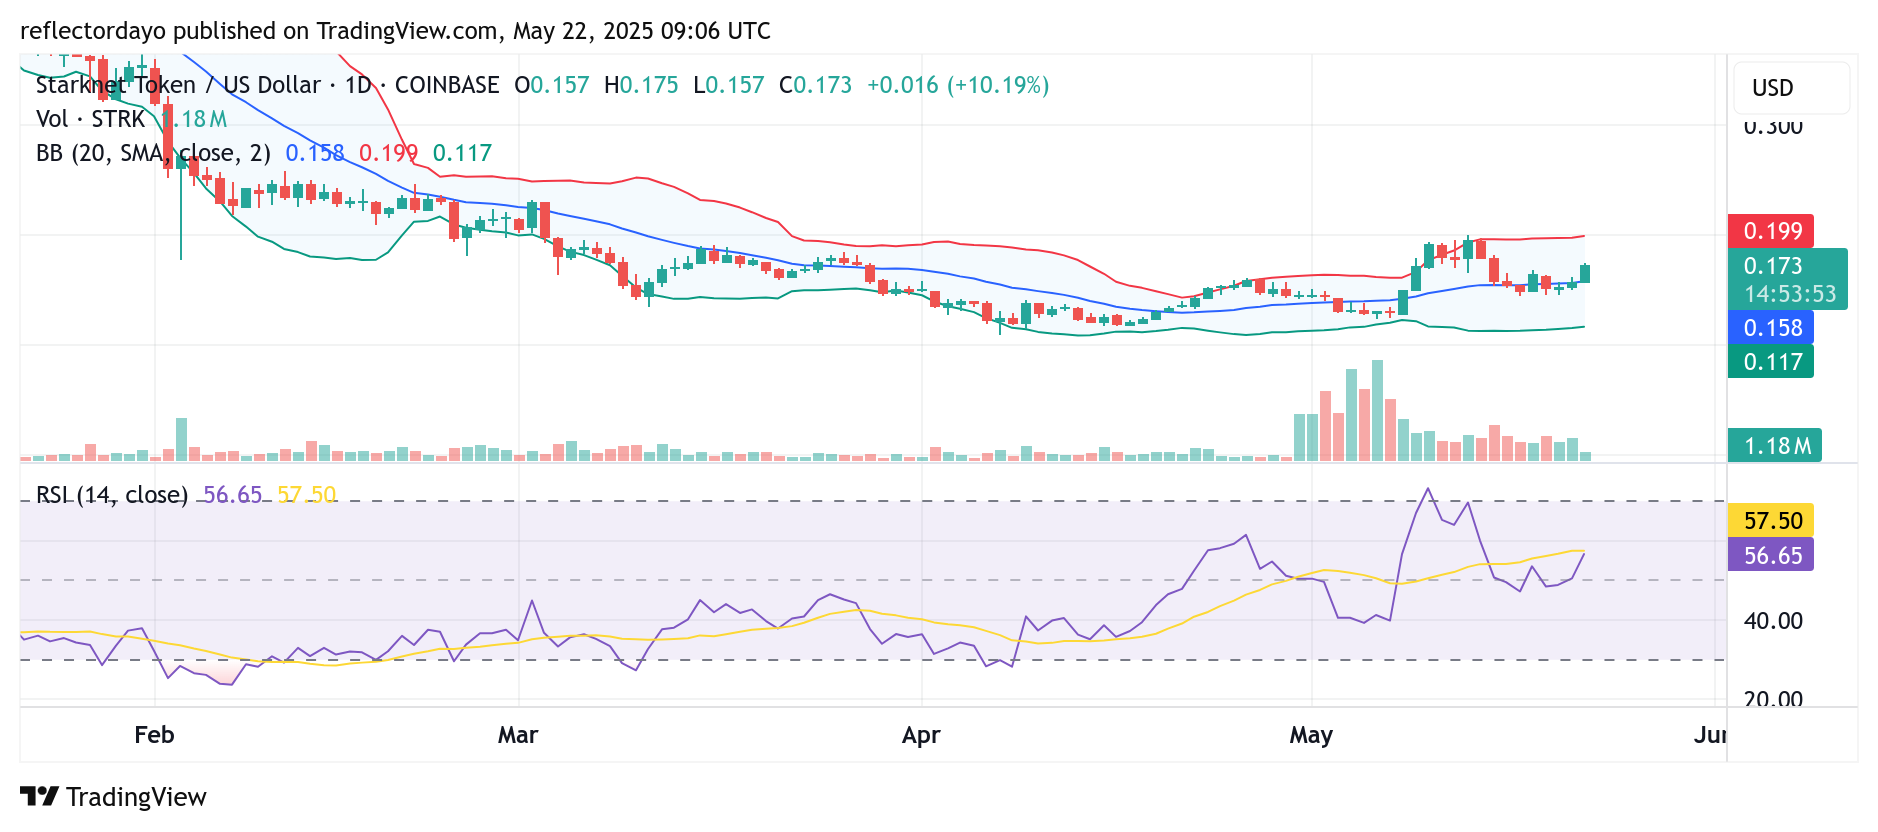
Starknet (STRK/USD) Technical Outlook: Market Pauses as Bulls Defend Key Support at $0.16
From a technical standpoint, the Starknet market appears to be in a consolidation phase as it digests prior movements. The price is narrowing into a tighter range, with bulls currently defending the 20-day moving average support around $0.16. Meanwhile, declining trading volume suggests that many market participants are waiting for a more decisive signal before committing to new positions.
One key development is today’s bullish Marubozu candlestick, which could signal a potential shift in sentiment, particularly following a series of indecisive candles. Although the candle lacks strong volume confirmation, its structure—characterized by a full-bodied close near the session’s high—suggests that buyers are beginning to reassert themselves.
The divergence between waning volume and the emergence of a strong bullish candle is noteworthy. This crypto signal pattern can sometimes act as a precursor to a breakout, but without confirmation in the next few sessions, the momentum could stall. Traders should watch for follow-through and volume resurgence as confirmation of a potential bullish continuation.
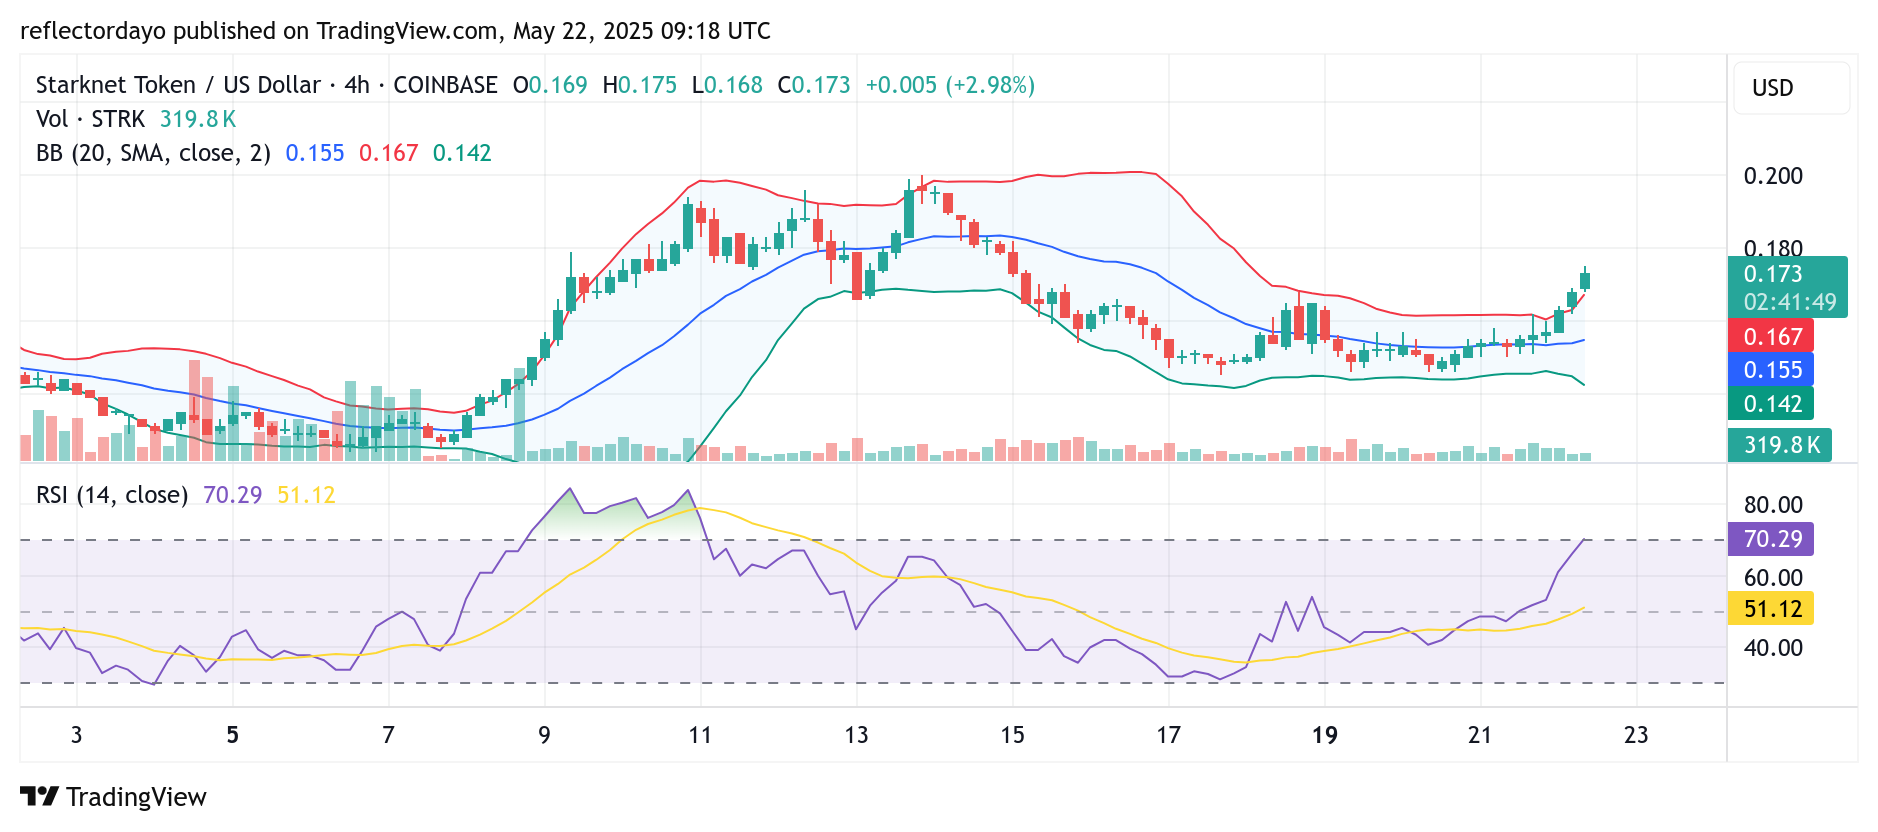
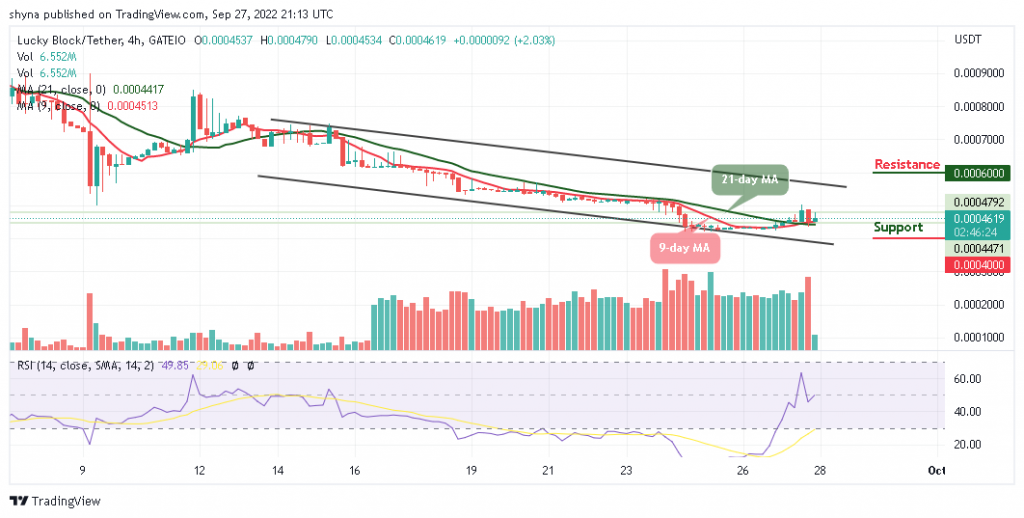
STRK/USD 4-Hour Chart: Bulls Take the Lead, but Volume Lags Behind
A closer look at the 4-hour chart of STRK/USD reveals continued bullish dominance, with price action pushing into the overbought zone. This indicates sustained upward momentum in the short term.
However, despite the bullish advance, trading volume remains relatively muted compared to the size of recent candlesticks. This divergence suggests that while buyers are currently in control, the move lacks strong participation—an important factor for confirming trend strength.
Should bullish momentum persist and manage to draw in greater market interest, trading volume may begin to rise, reinforcing the upward trajectory. In such a scenario, a further price surge toward the $0.20 level could become a realistic near-term target.