Lucky Block Price Prediction: LBLOCK/USD Moves Near $0.0005 Level
Estimated Reading Time: 2 minutes
Don’t invest unless you’re prepared to lose all the money you invest. This is a high-risk investment and you are unlikely to be protected if something goes wrong. Take 2 minutes to learn more

Free Crypto Signals Channel
The Lucky Block price prediction will break above the $0.00049 level to hit the $0.00050 resistance level as the bulls face the north.
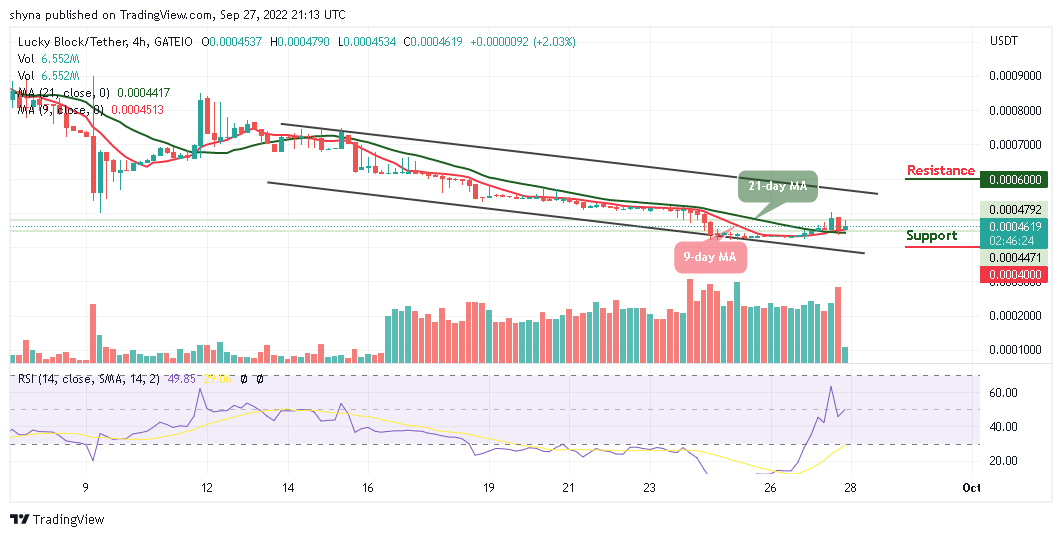
LBLOCK/USD Medium-term Trend: Ranging (4H Chart)
Key Levels:
Resistance levels: $0.0006, $0.0007, $0.0008
Support levels: $0.0004, $0.0003, $0.0002
LBLOCK/USD is trading above the 9-day and 21-day moving averages as the bullish pressure prepares the coin for the upside. However, before the coin break to the north, the coin will consolidate for a while to allow more buyers to come into the market.
Lucky Block Price Prediction: LBLOCK/USD Gets Ready for the North
The Lucky Block price is at the time of writing changing hands at $0.00046 where it retreats slightly, as soon as the bulls step into the market and push the coin above the upper boundary of the channel, the coin will locate the potential resistance levels at $0.0006, $0.0007, and $0.0008 while the support levels may come at $0.0004, $0.0003, and $0.0002 which could allow the new entries as the technical indicator Relative Strength Index (14) moves to cross above the 50-level.
LBLOCK/USD Medium-term Trend: Bullish (1H Chart)
The Lucky Block price is trading within the 9-day and 21-day moving averages. Meanwhile, the technical indicator Relative Strength Index (14) confirms that the coin will move positively, and any further bullish movement towards the upper boundary of the channel will hit the resistance level at $0.0005 and above.
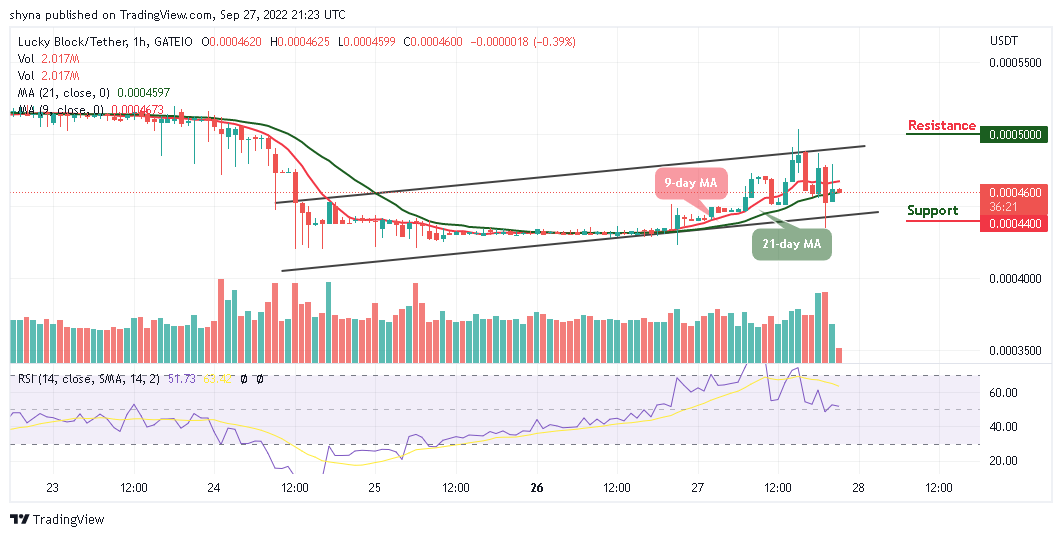
However, the crypto would experience more bullish signals as soon as the coin crosses above the 21-day moving average but if the price drop below the current market value, it will be an opportunity for new buyers to come into the market as the price could touch the support at $0.00044 and below.
You can purchase Lucky Block here. Buy LBLOCK