Battle Infinity Market Forecast: IBAT Is Springing Back Upward
Estimated Reading Time: 3 minutes
Don’t invest unless you’re prepared to lose all the money you invest. This is a high-risk investment and you are unlikely to be protected if something goes wrong. Take 2 minutes to learn more

Free Crypto Signals Channel
 Free Telegram Channel
Battle Infinity Market Forecast – August 25
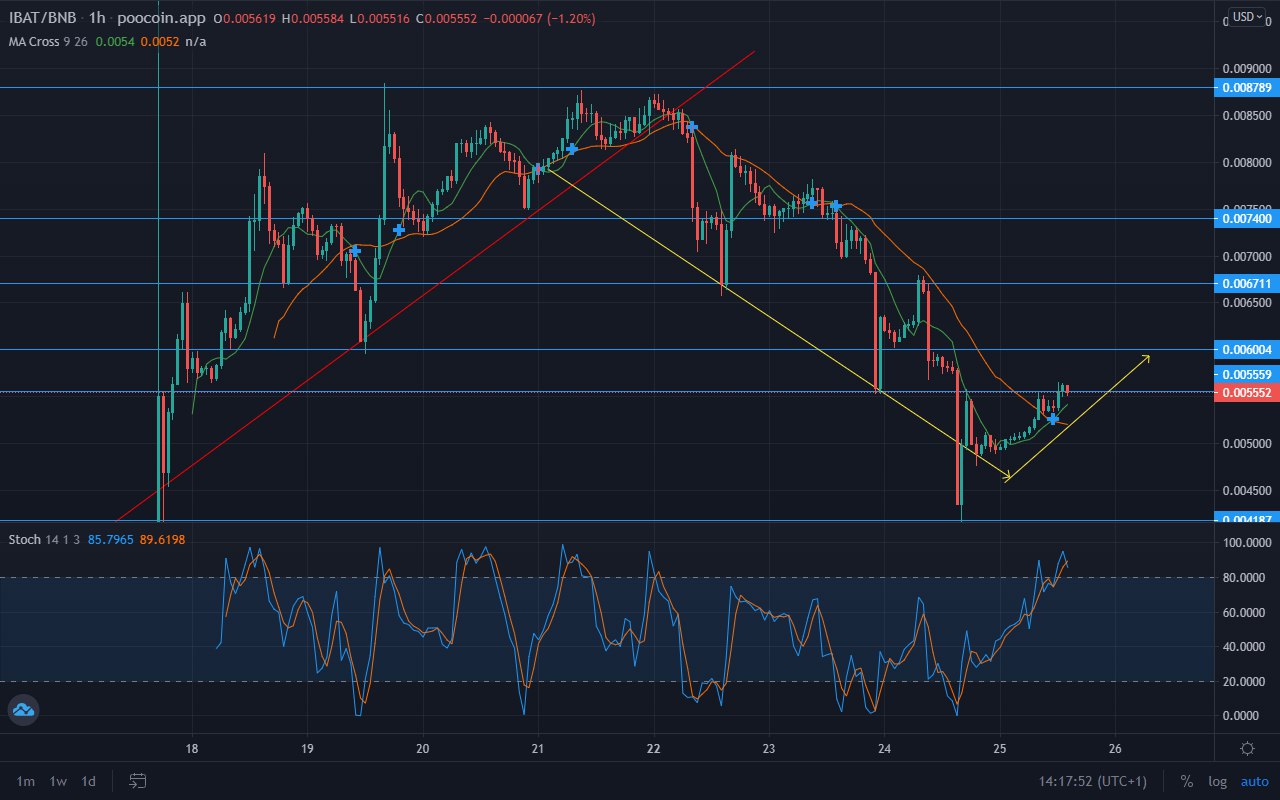
Battle Infinity market forecast is for the coin to keep rallying upwards after it springs upwards from the $0.0041870 significant support level.
IBAT/USD Long-Term Trend: Bullish (1-Hour Chart)
Key Levels:
Supply Zones: $0.0074000, $0.0087890
Demand Zones: $0.0041870, $0.0055590
IBAT remains in an accumulation phase, building up the impulse to escape the clutch of the bears around the $0.0087890 resistance level. The price has fallen to a trough point on the demand level and is now rallying upward from the same level. The bulls are being backed to drive the price back to the resistance level and then break it.
Battle Infinity Market Forecast: IBAT Is Strongly Bullish
The price trend line clearly earmarks the market’s direction. A first trendline is seen to lead the price in an upward direction, but its lead gets terminated at the $0.0087890 resistance level.
Another trendline brings the price crashing through several key levels to reach the $0.0041870 support level. The trendline’s purpose is to lift the IBAT back as expected to be.
The price is now springing upwards from the support level. Another trendline has been placed to lead the line upward from the support level. The MA Cross (Moving Average) lines have crossed upward.
IBAT/USD Medium-Term Trend: Bullish (15-minute chart)
The 15-minute chart shows the point at which the price takes off, switching from a descending trendline to an ascending one. As a result, the MA Cross lines have crossed upward from below the 15-minute candlesticks and are further acting as an extra layer of support from below for the market.
Also, this results in the Stochastic Oscillator lines immediately rising into the overbought region. This is the same thing on the 1hour chart. This points to the fact that bullish strength is prevailing. The coin is expected to rise to break the ranging zone resistance line at $0.0087890.
Battle Infinity has huge potential for unusually massive returns. Buy IBAT
Note: Cryptosignals.org is not a financial advisor. Do your research before investing your funds in any financial asset or presented product or event. We are not responsible for your investing results.