Bitcoin (BTC) Price Prediction: BTC/USDT Registers a Modest Pullback
Estimated Reading Time: 3 minutes
Don’t invest unless you’re prepared to lose all the money you invest. This is a high-risk investment and you are unlikely to be protected if something goes wrong. Take 2 minutes to learn more

Date: October 29, 2025
The Bitcoin market recently rebounded off a lower support at the $107,000 price mark. The market subsequently moved past the $115,000 price level. Although it is currently experiencing some setbacks, it seems likely that the market may soon bounce back.
BTC/USDT Long-Term Trend — Bearish (Daily Chart)
Key Price Levels
Resistance: $112,500, $115,000, $117,500
Support: $110,000, $107,500, $105,000
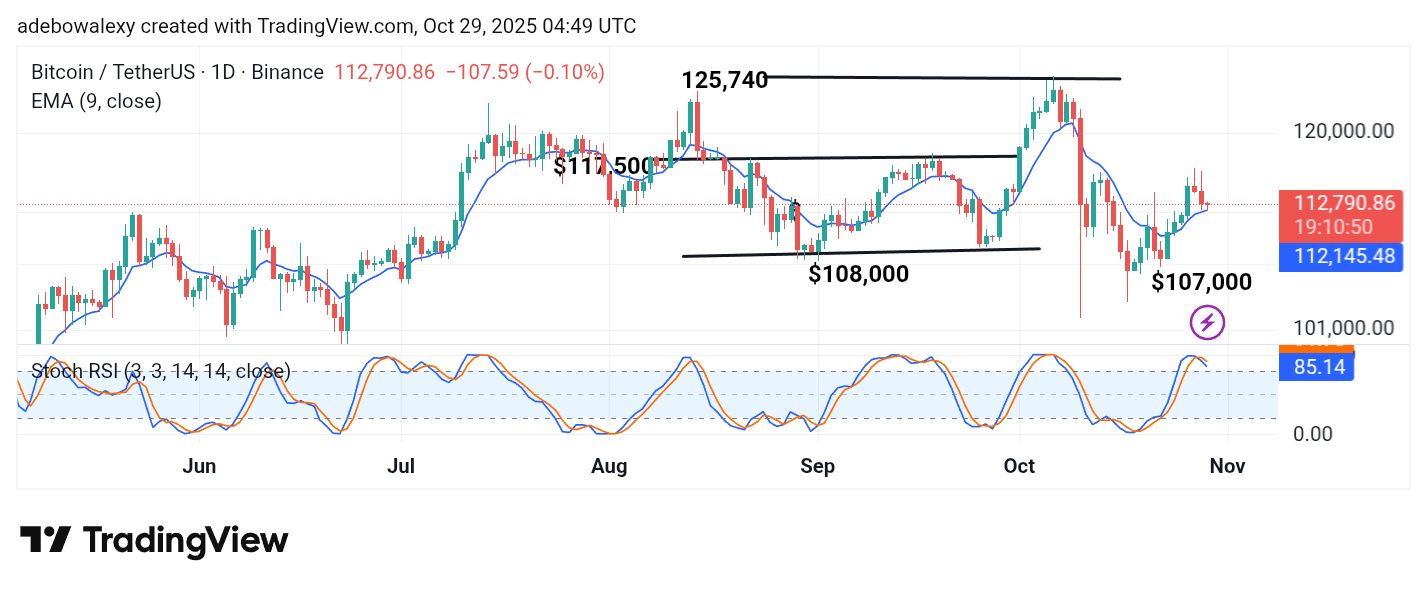
There has been a steady price decline in the Bitcoin market for three consecutive sessions. The ongoing session remains bearish, maintaining the integrity of the downward retracement but still staying above the 9-day Exponential Moving Average (EMA) line. The corresponding price candle for the ongoing session, however, appears considerably small. Additionally, the lines of the Stochastic Relative Strength Index (SRSI) indicator have reached the overbought region and have started a downward trajectory after bouncing off the 100 mark.
Bitcoin Price Prediction: BTC/USDT Traders Eye the 9-Day EMA Curve for a Bounce
It is clear that the Bitcoin market has seen a notable pullback over the past three sessions on the daily chart. The current session, however, still reflects continued selling pressure.
Yet, considering the small size of the last price candle on the chart, it seems traders are beginning to hold back from selling. Furthermore, the SRSI indicator lines can still be seen above the 80 mark despite their downward trajectory. This suggests that upside forces may soon regain traction, causing prices to resume an upward correction.
Bitcoin Price Prediction: BTC/USDT Upside Bounce Starts (4-Hour Chart)
On the 4-hour chart, Bitcoin’s price can already be seen rebounding off the 9-day EMA curve. The previous session appears as a small, upwardly contracted price candle. The corresponding price candle for the ongoing session, however, is green, indicating an upward bounce off the drawn, upward-sloping trendline.
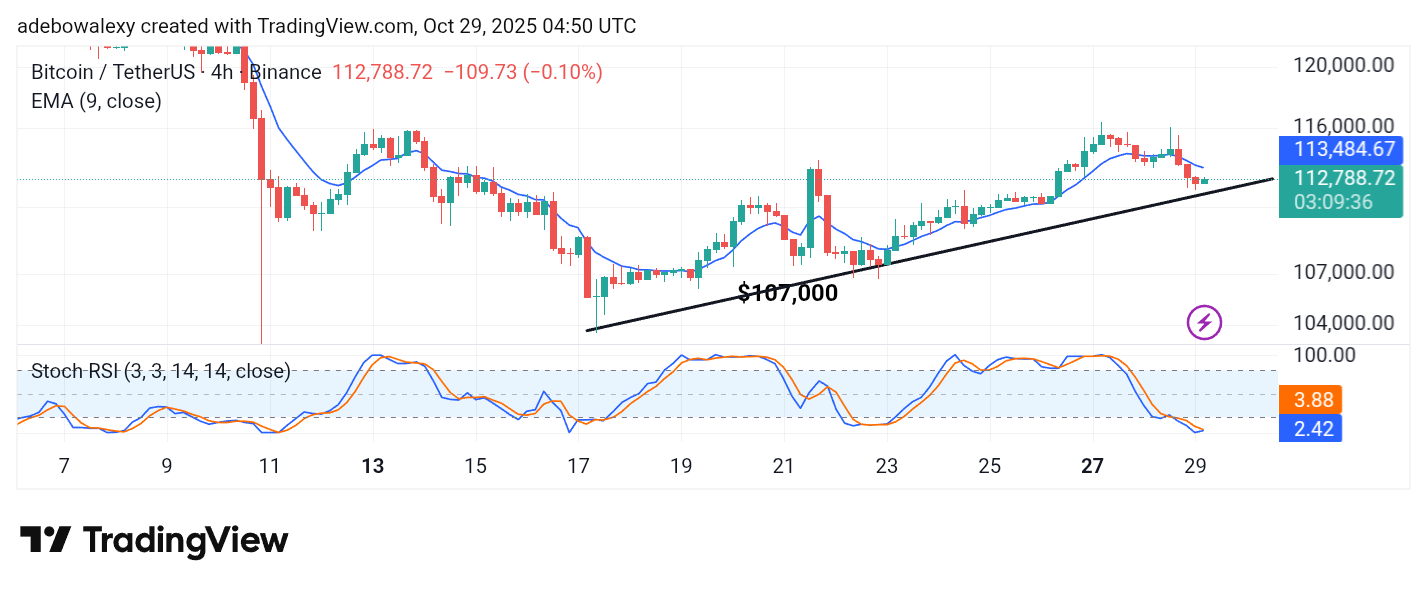
Meanwhile, the SRSI indicator lines are now converging for an upside crossover in the oversold region. This stands despite price action still lying below the 9-day EMA curve. At this point, traders can anticipate a continued upward rebound toward the $115,000 mark initially, and possibly higher, as bullish momentum strengthens.