SpongeBob (SPONGE/USD) Prepares to Skyrocket
Estimated Reading Time: 3 minutes
Don’t invest unless you’re prepared to lose all the money you invest. This is a high-risk investment and you are unlikely to be protected if something goes wrong. Take 2 minutes to learn more

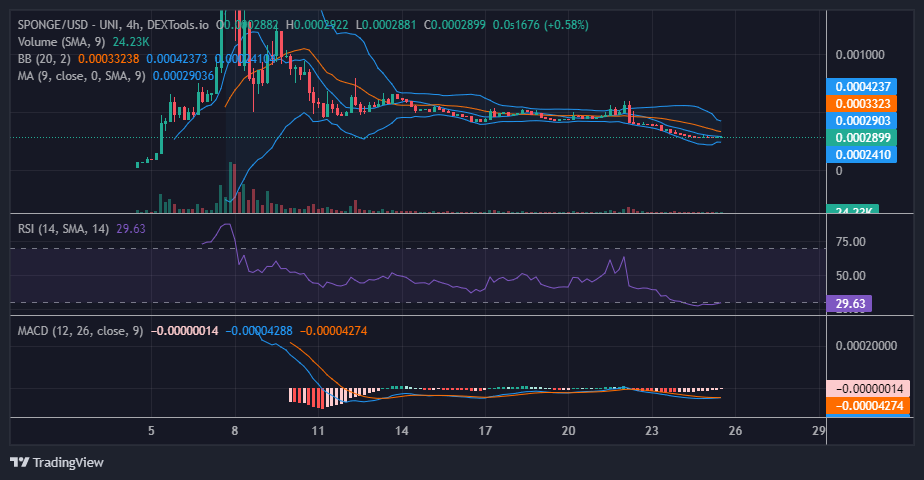
The continuous bearish sentiment has forced the SpongeBob market to settle below the key support level of $0.00038. Before buyers lost grip of this support level, the market gridlock had reached such a critical stage that the demand level had to settle at a lower level of $0.000269. Once again, at this new level, the tug-of-war is reaching its climax, and bulls, having been forced below the key support, might take this as an advantage to spring into action, setting the market up for upside action.
Key Levels
- Resistance: $0.0007855, $0.0010, and $0.00117
- Support: $0.00040, $0.00035, and $0.00032
SpongeBob (SPONGE/USD) Price Analysis: The Indicators’ Point of View
The Bollinger Bands indicator did not converge in the recent bearish breakout; rather, the bands moved apart from each other. However, this time around, as the support and resistance levels grow closer to each other due to the deadlock, the bands of the Bollinger indicator converge. That means SpongeBob bulls are catching up, and the market may break out to the upside. To confirm this sentiment, the Moving Average Convergence and Divergence (MACD) show progressive faded red histograms. In addition to that, we are about to have a bullish crossover below level zero in the MACD indicator.
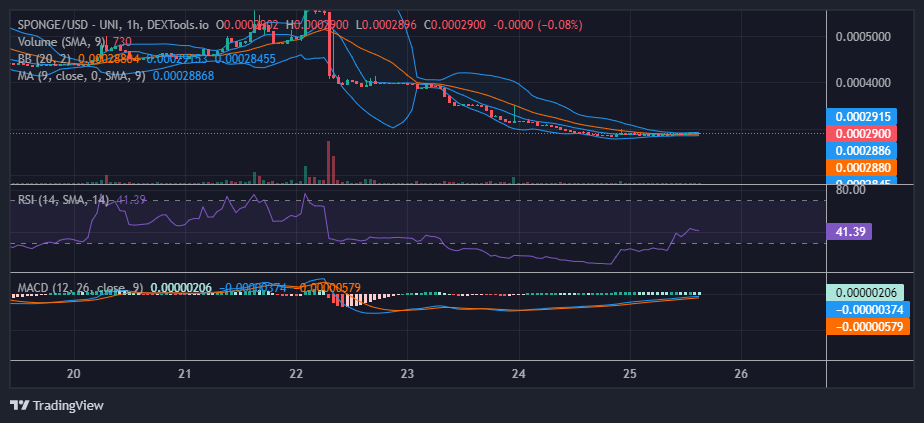
SPONGE/USD Short-Term Outlook: 1-Hour Chart
In the 4-hour chart outlook, the Relative Strength Index measures the momentum of the market in oversold territory. This is a contributing factor to the growing bullish sentiment around the current market level. On a 1-hour chart outlook, the market has started to see a bullish recovery, and bearish momentum is on the decline. Though it is not a fast decline, it is progressive. Bearish resistance is forming a barrier line to peg the emerging bullish recovery once again. To illustrate this new development in the Relative Strength Index, the RSI lines continue to range around level 41. In addition to that, the Bollinger Bands are extremely convergent. A bullish breakout is imminent.
Grab some extra $SPONGE whenever you have a chance. It is available for grabs.
Anytime is the perfect time to grab some more $SPONGE ! 🕒💰🧽 pic.twitter.com/0YZmh5t9ck
— $SPONGE (@spongeoneth) May 25, 2023
Invest in the hottest and best meme coin. Buy SpongeBob ($SPONGE) today!