The XRP Market (XRP/USD) Is on the Trail of the $0.600 Price Level
Estimated Reading Time: 2 minutes
Don’t invest unless you’re prepared to lose all the money you invest. This is a high-risk investment and you are unlikely to be protected if something goes wrong. Take 2 minutes to learn more
On March 29, the XRP market started its upside journey from the $0.37 price level and hit the year’s high at $0.57, then a significant bear market was triggered. However, because the bulls were stronger, they secured a higher support level on May 8, which forms the baseline for the current market price rebound.
XRP Market Data
- XRP/USD Price Now: $0.55
- XRP/USD Market Cap: $26,953,806,873
- XRP/USD Circulating Supply: 51,987,017,573 XRP
- XRP/USD Total Supply: 99,988,884,267
- XRP/USD Coinmarketcap Ranking: #6
Key Levels
- Resistance: $0.60, $0.65, $0.70
- Support: $0.45, $0.40, and $0.35
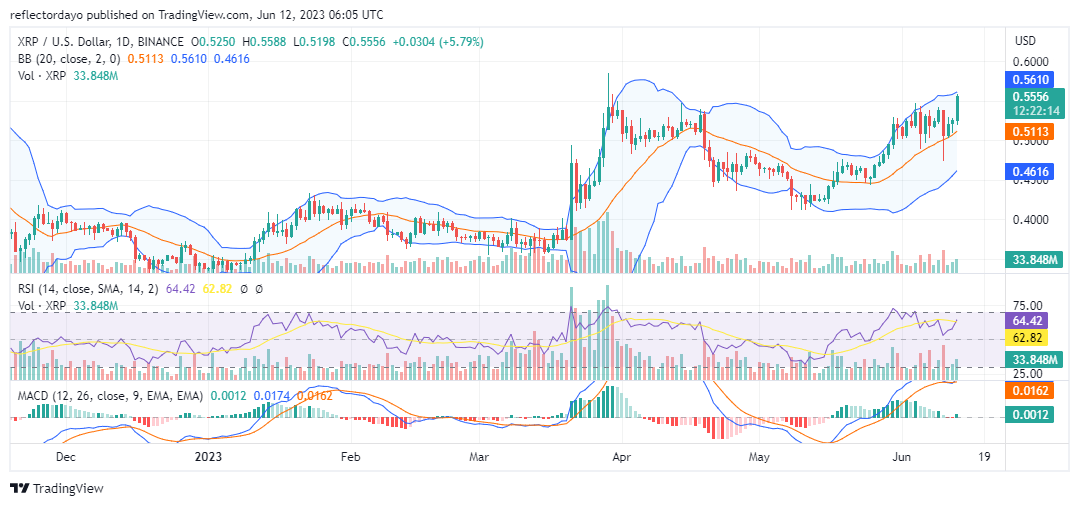
Price Prediction for the XRP Market: The Indicators’ Point of View
Today’s XRP market is seeing significant activity in the bull market, propelling the price above the key resistance level of $0.54. The market is on the trail of the year’s high, which is $0.57. However, with this aggressive bullish performance, the upper standard deviation curve of the Bollinger Bands indicator did not respond well to this latest and significant market development. Also, the volume of trade indicator did not commensurate with the strong bullish market movement of today. This gives rise to the concern that bulls may soon become exhausted and might need more bullish strength to push through new resistance levels.
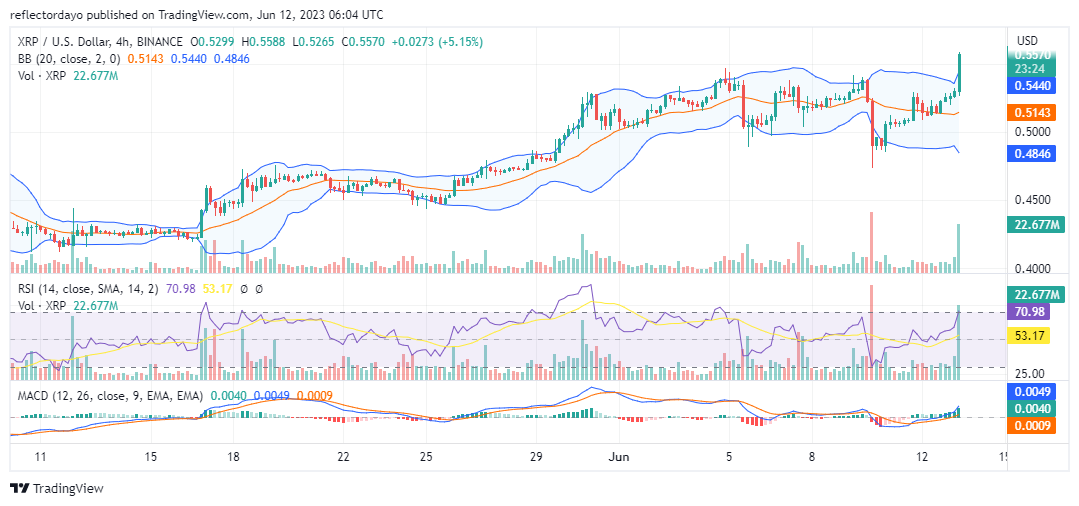
XRP/USD 4-Hour Chart Outlook
From a 4-hour perspective on the market, the XRP market is clearly in an uptrend. However, the strong bullish move of the third session of today’s market may probably trigger a one-sided bear market as bulls risk exhaustion. But just as the XRP bulls did in the previous market, if they eventually trigger the bear market, they will probably secure a higher baseline for the continuation of the bullish trend.