Chainlink Drops as It Encounters the $7.30 Initial Barrier
Estimated Reading Time: 2 minutes
Don’t invest unless you’re prepared to lose all the money you invest. This is a high-risk investment and you are unlikely to be protected if something goes wrong. Take 2 minutes to learn more
Chainlink (LINK) Long-Term Analysis: Bullish
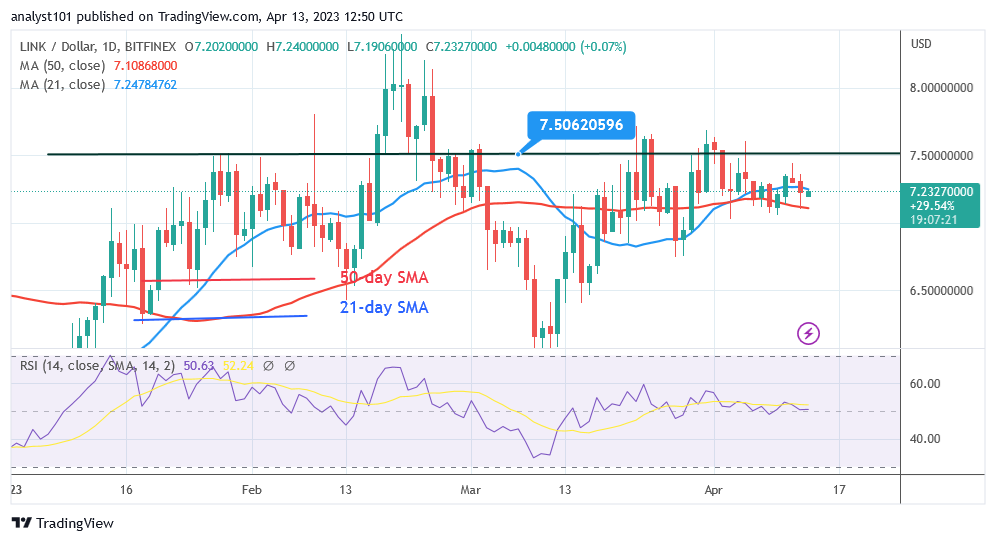
Chainlink’s (LINK) price is declining as it encounters the $7.30 initial barrier. Since March 1, the $7.50 resistance level has prevented further gains for the cryptocurrency asset. At $7.23, LINK/USD is trading between the moving average lines today. Chainlink has been unable to resume its bullish trend for the past month due to the resistance at $7.50. The price has typically been between $6.50 and $7.50. Currently, the moving average lines are being entered and exited by the LINK price. The altcoin will trend when the moving average lines cross. For instance, the altcoin is rising between the moving average lines. The cryptocurrency’s price will rise and retrace its steps toward its previous high of $7.50 if it crosses above the 21-day SMA.
Chainlink (LINK) Indicator Analysis
Chainlink is at Relative Strength Index level 50 for period 14. Due to a balance between supply and demand, the coin’s price has dropped to its equilibrium level. Since the price is pinned between the moving average lines, the altcoin will be forced to move in a range. The daily Stochastic’s level 30 is where the cryptocurrency asset is in a bullish momentum.
Technical indicators:
Major Resistance Levels – $18.00, $20.00, $22.00
Major Support Levels – $8.00, $6.00, $4.00
What Is the Next Direction for Chainlink (LINK)?
Chainlink is likely to enter a range-bound pattern as it encounters the $7.30 initial barrier. On the 4-hour chart, the altcoin is trading between $7.00 and $7.50. The high of $7.30 acts as a barrier to upward movement.

You can purchase crypto coins here. Buy LBLOCK
Note: Cryptosignals.org is not a financial advisor. Do your research before investing your funds in any financial asset or presented product or event. We are not responsible for your investing results