Solana (SOL) Price Prediction: SOL/USDT Heads Toward the $150 Threshold
Estimated Reading Time: 3 minutes
Don’t invest unless you’re prepared to lose all the money you invest. This is a high-risk investment and you are unlikely to be protected if something goes wrong. Take 2 minutes to learn more

Date: November 7, 2025
As Bitcoin’s price continues to spiral to a multi-month low, the prices of other altcoins in the crypto market have also followed suit. Solana (SOL) is one of such coins, and its price continues to decline toward a level that has not been tested in several months.
Long-Term Trend — Bearish (Daily Chart)
Key Price Levels:
Resistance: $160, $180, $190
Support: $150, $140, $130
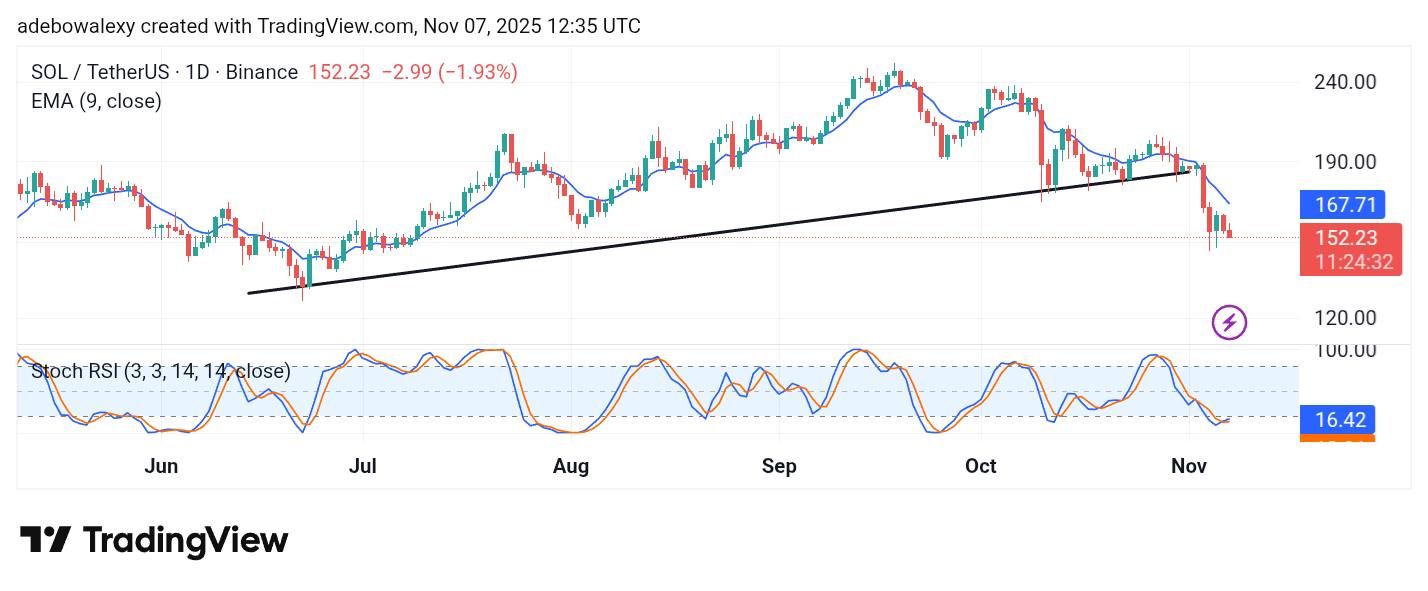
The Solana market continues to head toward the $150 price level after previously testing the $200 mark. The market has experienced a strong downward retracement over the past four sessions, though momentum started to weaken two sessions ago.
The ongoing session has maintained the bearish trajectory, as reflected by the red appearance of the current daily candle. Price action is now positioned significantly below the 9-day Exponential Moving Average (EMA) curve.
Meanwhile, the Stochastic Relative Strength Index (SRSI) lines maintain an upward trajectory after a bullish crossover in the oversold region, suggesting a possible short-term recovery attempt amid the broader bearish trend.
Solana (SOL) Price Prediction: Solana Maintains a Bearish Path
The Solana market has resumed a downward movement in the current session. This observation is based on the appearance of the latest price candle, following two sessions of consolidation.
The recent candle on the daily chart signals a continuation of the downward correction. With price action remaining below the 9-day EMA, bearish momentum continues to dominate.
At the same time, the SRSI lines are trending upward but remain within the oversold zone, indicating that while selling pressure persists, the market may be approaching a potential rebound area.
Solana (SOL) Price Prediction: SOL/USDT Heads South (4-Hour Chart)
On the 4-hour chart, Solana has sustained a bearish trajectory for the second consecutive session. The latest candle continues to descend, keeping price activity well below the 9-day EMA line.
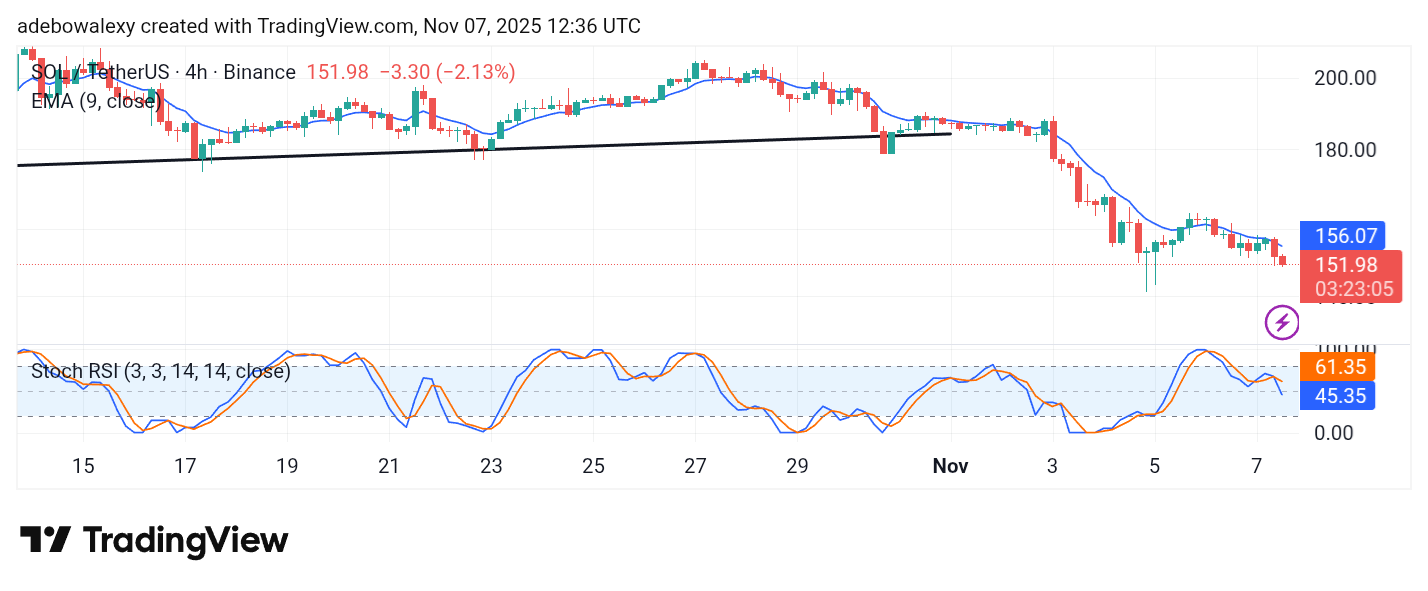
Similarly, the SRSI indicator lines are moving downward after a bearish crossover just below the 80 mark. The lead line is now falling steeply toward the 50 level, reinforcing the dominance of bearish forces in the short term.
Therefore, traders may consider aiming for short-term gains around the $150 price level, which serves as the next key support zone.