Solana (SOL) Price Prediction: SOL/USDT Upholds General but Slow Upside Path
Estimated Reading Time: 2 minutes
Don’t invest unless you’re prepared to lose all the money you invest. This is a high-risk investment and you are unlikely to be protected if something goes wrong. Take 2 minutes to learn more

Date: October 31, 2025
The Solana market has maintained an overall upward bearing since June this year. And while it was reduced to a sideways-moving market at some point, the drawn upward-sloping trendline in the chart can be seen portraying the fact that this market still maintains an upward direction.
Long-Term Trend — Bearish (Daily Chart)
Key Price Levels:
Resistance: $190, $200, $210
Support: $180, $175, $170
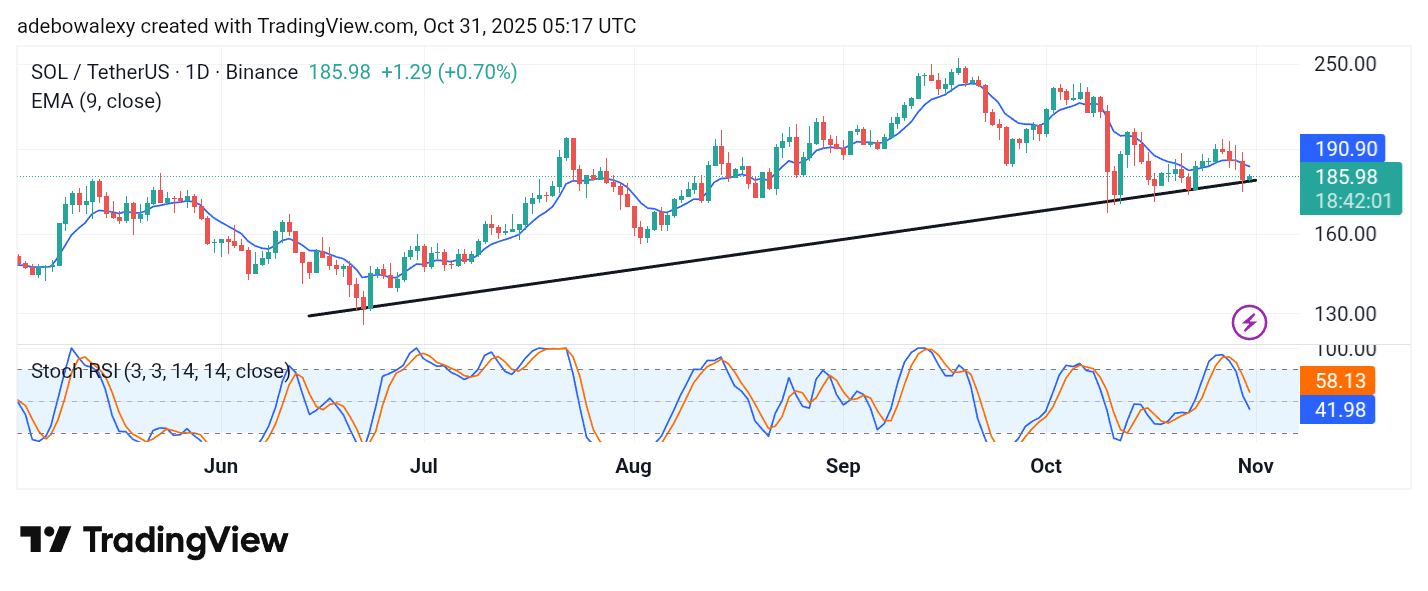
Today’s session has landed an upward rebound. The corresponding price candle can be seen to have appeared green but smaller than that of the previous session. The market had seen a strong price decline in the previous session, which brought the market to test the drawn upward-sloping trendline. Also, price action remains below the 9-day Exponential Moving Average (EMA) curve. The Stochastic Relative Strength Index (SRSI) indicator lines, however, are slumping into the oversold region of the indicator.
Solana (SOL) Price Prediction: Solana Stays Bearish but May Maintain Its Upward Trajectory
As mentioned above, the Solana market has a subdued outlook. The current session stands bullish but has a very minimal effect, seeing that price action remains below the 9-day EMA curve.
However, the drawn upside-sloping trendline is serving as strong support. The SRSI indicator lines are also dropping sharply toward the oversold zone of the indicator. As of now, the market looks well subdued and hints at a possible continued downward retracement.
Solana (SOL) Price Prediction: SOL/USDT Slight Upward Recovery Needs More Traction (4-Hour Chart)
Moving to the Solana market on a 4-hour price chart shows that upside correction has been occurring on a minimal scale. Here, the last three price candles are green; however, the last two seem to have weak bullish momentum.
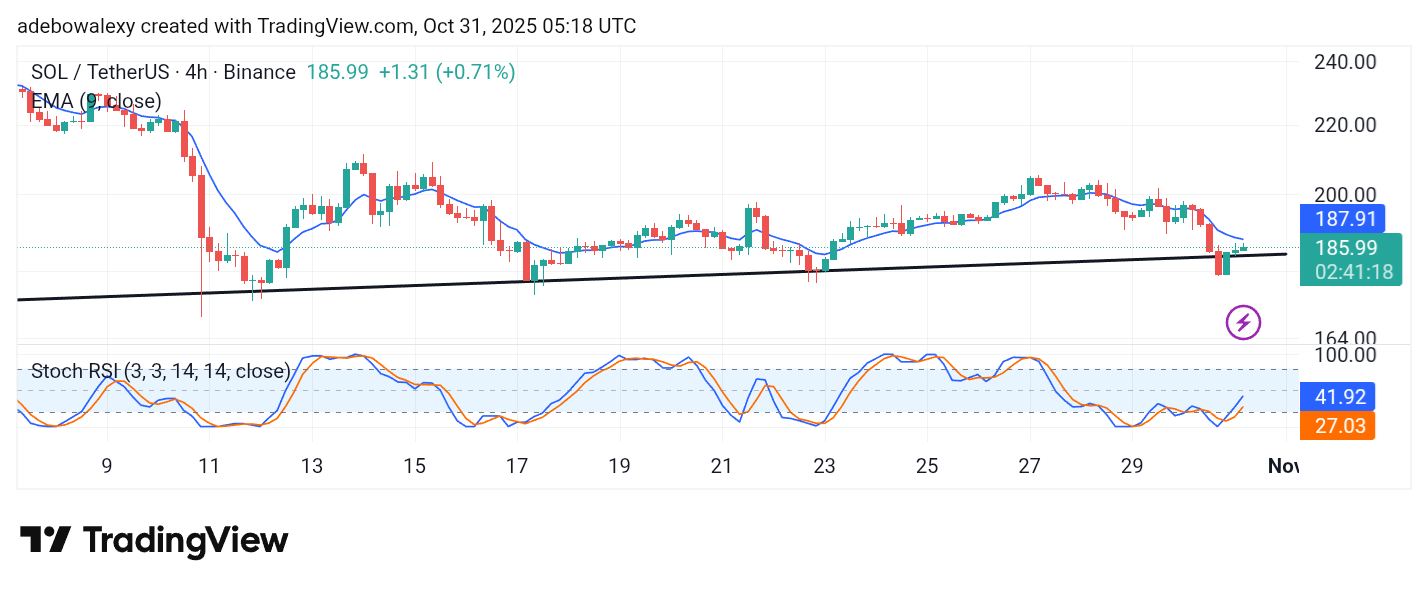
These price candles are still seen below the 9-day EMA curve. Similarly, the lines of the SRSI indicator still stand poised upward toward the 50 mark of the indicator. Nevertheless, price activity will have to rise past the 9-day EMA curve to suggest a significant short-term price increase toward the $200 mark.