Solana (SOL) Price Prediction: SOL/USDT Extends a Short-Term Bounce
Estimated Reading Time: 2 minutes
Don’t invest unless you’re prepared to lose all the money you invest. This is a high-risk investment and you are unlikely to be protected if something goes wrong. Take 2 minutes to learn more

Date: October 24, 2025
The Solana market has been on a general upward path since June, when price activity rebounded from around the $140 threshold. While the market recently saw another rebound in the previous session, it can be said to be maintaining its longer-term trajectory toward the $200 price level.
Long-Term Trend — Bullish (Daily Chart)
Key Price Levels:
Resistance: $200, $210, $220
Support: $190, $180, $170
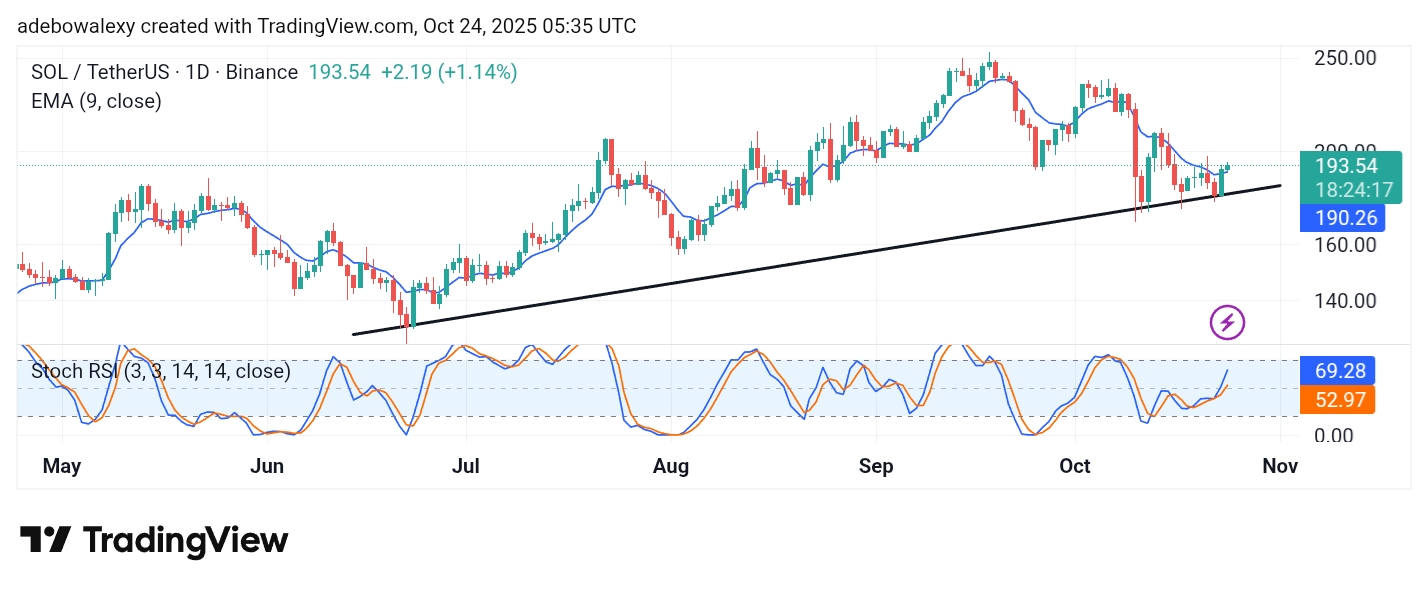
The Solana market rebounded northward in the previous session with notable momentum. However, the ongoing session has continued in the same direction at the time of writing. As a result, price action now stands above the 9-day Exponential Moving Average (EMA) curve. The Stochastic Relative Strength Index (SRSI) indicator lines are still projected upward from below the 50 threshold level, suggesting continued bullish pressure.
Solana (SOL) Price Prediction: Solana Bulls Keep Upside Focus
The ongoing session in the Solana market has remained above the 9-day EMA curve. Likewise, the corresponding price candle appears green, sustaining a bullish impression.
The SRSI indicator lines are rising steeply upward from below the 50 threshold level, which technically indicates that the market may still have a short-term upward target. Overall, technical indications continue to align in support of near-term bullish momentum.
Solana (SOL) Price Prediction: SOL/USDT Holds a Brave Stand (4-Hour Chart)
On the 4-hour chart, Solana’s price action appears to be gaining stronger bullish momentum. The latest price candle stands above the 9-day EMA line and is more prominent than the previous candle on the chart.
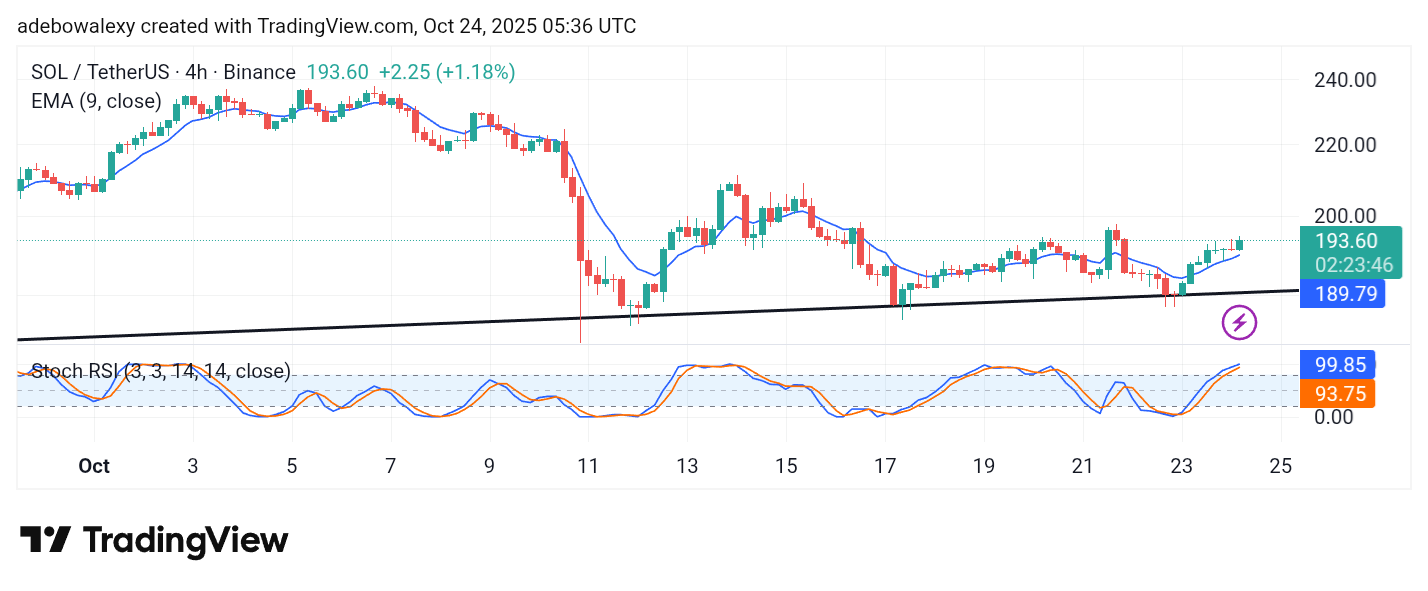
Furthermore, price movement has been proceeding slightly upward along a drawn ascending trendline, revealing that the longer-term bullish trajectory remains intact.
At the same time, the lines of the Stochastic Relative Strength Index (SRSI) have risen into the overbought region. However, traders should anticipate a possible pullback, which may allow price action to retest or even approach the $200 price level.