Bitcoin (BTC) Price Prediction: BTC/USDT Fails to Gather Escape Velocity
Estimated Reading Time: 2 minutes
Don’t invest unless you’re prepared to lose all the money you invest. This is a high-risk investment and you are unlikely to be protected if something goes wrong. Take 2 minutes to learn more

Date: October 22, 2025
The Bitcoin market has been retracing downward after encountering resistance formed by a technical indicator. As such, the coin has not been able to gather enough bullish momentum to trigger a notable upward correction. This has kept the market in bearish territory.
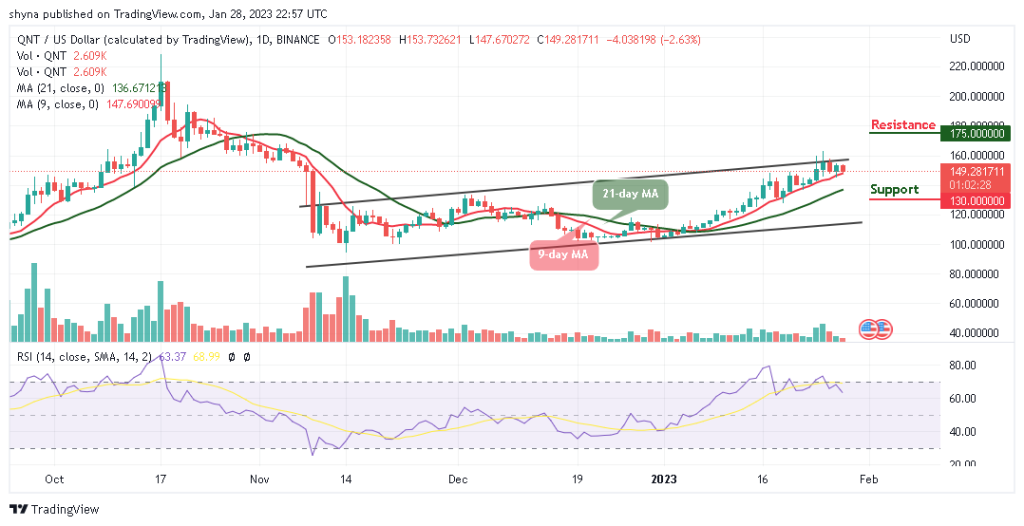
BTC/USDT Long-Term Trend — Bullish (Daily Chart)
Key Price Levels
Resistance: $110,000, $112,500, $115,000
Support: $107,000, $105,000, $103,000
Bitcoin’s price action has remained sealed below the 9-day Exponential Moving Average (EMA) for nearly two weeks. Price movement continues to bounce downward each time it tests the 9-day EMA curve. The ongoing session is represented by a small red candle positioned below the 9-day EMA. Meanwhile, the Stochastic Relative Strength Index (SRSI) indicator lines show a slight upward trajectory from the oversold region.
Bitcoin Price Prediction: BTC/USDT Remains Bearishly Inclined
The Bitcoin market has retained its bearish outlook for the past two weeks. However, the market recently witnessed an upward rebound around the $102,000 price level. Despite this, it continues to trade below key technical levels, particularly the 9-day EMA. The ongoing session still reflects a bearish tone, albeit marginally.
The SRSI indicator lines maintain a gentle upward movement following the previously mentioned rebound from $102,000. While this appears to be a lagging reaction on the SRSI, it still suggests that the recent upward retracement has not been entirely neutralized.
Bitcoin Price Prediction: BTC/USDT May Continue to Decline (4-Hour Chart)
In the 4-hour Bitcoin market, price action maintains a downward orientation. However, the prevailing bearish momentum appears to be facing slight bullish pressure. The latest price candle is slightly larger than the one from the previous session and has formed below the 9-day EMA, with a lower opening compared to the prior session.
Additionally, the SRSI indicator lines are still descending into the oversold region following the last bearish crossover. Consequently, the market may continue its decline toward the $105,000 price level in the short term.