Bitcoin (BTC) Price Prediction: BTC/USDT Stays Below $115,600
Estimated Reading Time: 2 minutes
Don’t invest unless you’re prepared to lose all the money you invest. This is a high-risk investment and you are unlikely to be protected if something goes wrong. Take 2 minutes to learn more

Date: October 14, 2025
Following the steep price fall that occurred recently in the Bitcoin daily market, it can be observed that price activity has yet to gather significant momentum. As a result, the most recent price candles have remained below several key technical levels.
BTC/USDT Long-Term Trend — Bullish (Daily Chart)
Key Price Levels
Resistance: $112,500, $115,000, $117,500
Support: $110,000, $107,500, $105,000
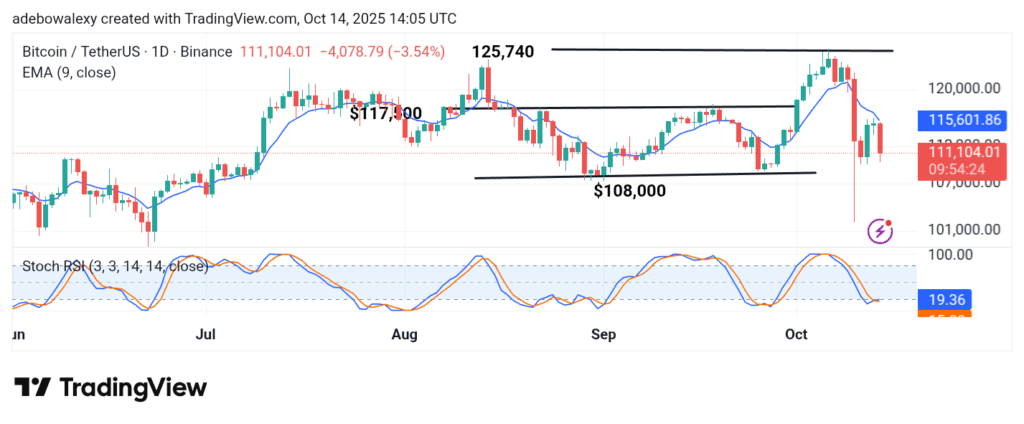
The ongoing session on the Bitcoin daily chart is represented by a large red price candle, which has formed below the 9-day Exponential Moving Average (EMA) curve. As of the time of writing, trading stands slightly above the $111,000 price level.
Meanwhile, the lines of the Stochastic Relative Strength Index (SRSI) indicator are maintaining a sideways trajectory after a bearish crossover in the overbought region — signaling that momentum remains weak for now.
Bitcoin Price Prediction: BTC/USDT Looks Burdened
The Bitcoin market currently presents a bearish outlook, with price action struggling below key technical thresholds. The latest price candle representing the ongoing session is a bearish one, pushing the market further below the 9-day EMA line.
Additionally, the SRSI indicator lines appear to be gradually yielding to bearish pressure, trending sideways within the oversold region. This development suggests that bearish sentiment remains dominant, and buying momentum is still weak at this point.
Bitcoin Price Prediction: BTC/USDT Bearish Progress Faces Friction (4-Hour Chart)
On the 4-hour chart, Bitcoin’s downward forces seem to be encountering some friction. This is evident from the appearance of the last two price candles, which stand below the 9-day EMA curve but feature long lower shadows — a sign that bulls are offering resistance to further declines.
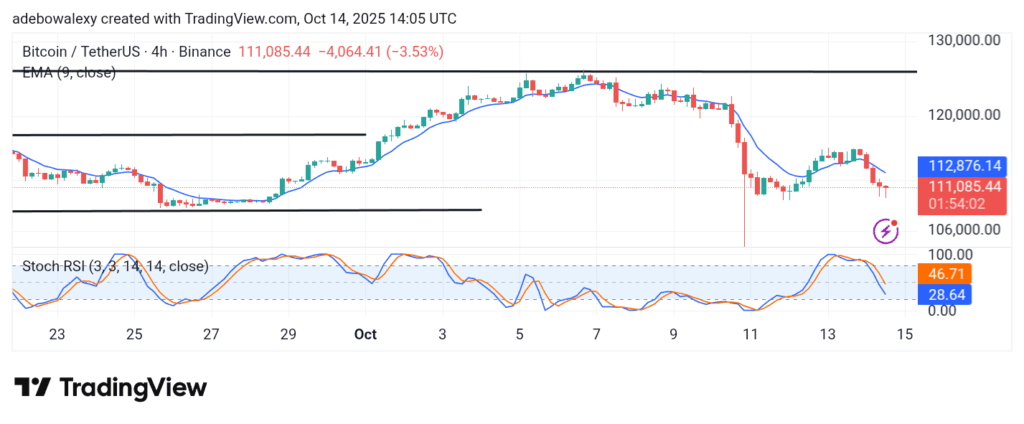
However, the SRSI indicator lines continue to descend into the oversold region, which tentatively weakens the argument that downward pressure is easing.
That said, traders may prefer to wait for a clear bullish bounce before considering long positions toward the $115,000 price level.