Bitcoin (BTC) Price Prediction: BTC/USDT Breaks Above the $121,000 Price Level
Estimated Reading Time: 3 minutes
Don’t invest unless you’re prepared to lose all the money you invest. This is a high-risk investment and you are unlikely to be protected if something goes wrong. Take 2 minutes to learn more

Date: October 8, 2025
The Bitcoin market has recently come alive, with prices surging sharply and pushing through the $126,000 level. There are indications supporting the view that the upward movement may resume. In fact, the ongoing session shows a somewhat bullish bias above a key technical level.
BTC/USDT Long-Term Trend — Bullish (Daily Chart)
Key Price Levels:
Resistance: $122,500, $125,000, $127,500
Support: $120,000, $117,500, $115,000

The Bitcoin market has made significant progress over the past few days. Current price action has risen above the 9-day Exponential Moving Average (EMA) line. The ongoing session is represented by a Doji candle pattern, indicating market indecision.
The Stochastic Relative Strength Index (SRSI) has entered the overbought region but is now trending downward toward the 80 level, suggesting a potential correction before the next upward move.
Bitcoin Price Prediction: BTC/USDT Maintains a Bullish Bias
Price action in the Bitcoin market currently shows a solid base for a bullish continuation. The appearance of a green Doji candle in the ongoing session suggests that market momentum is building again. This has led to a retracement that paused above the $121,450 level—still above the 9-day EMA line.
Although the SRSI lines remain in the overbought zone, they are trending downward due to the recent sharp correction. Nevertheless, given the current market structure, there are strong indications that price action may advance higher in the coming sessions.
Bitcoin Price Prediction: BTC/USDT Appears Set for an Upward Rebound (4-Hour Chart)
On the shorter time frame, Bitcoin shows signs of a short-term uptrend. Over the past three sessions, price movement has been somewhat sideways, but momentum has started shifting upward since the previous session.
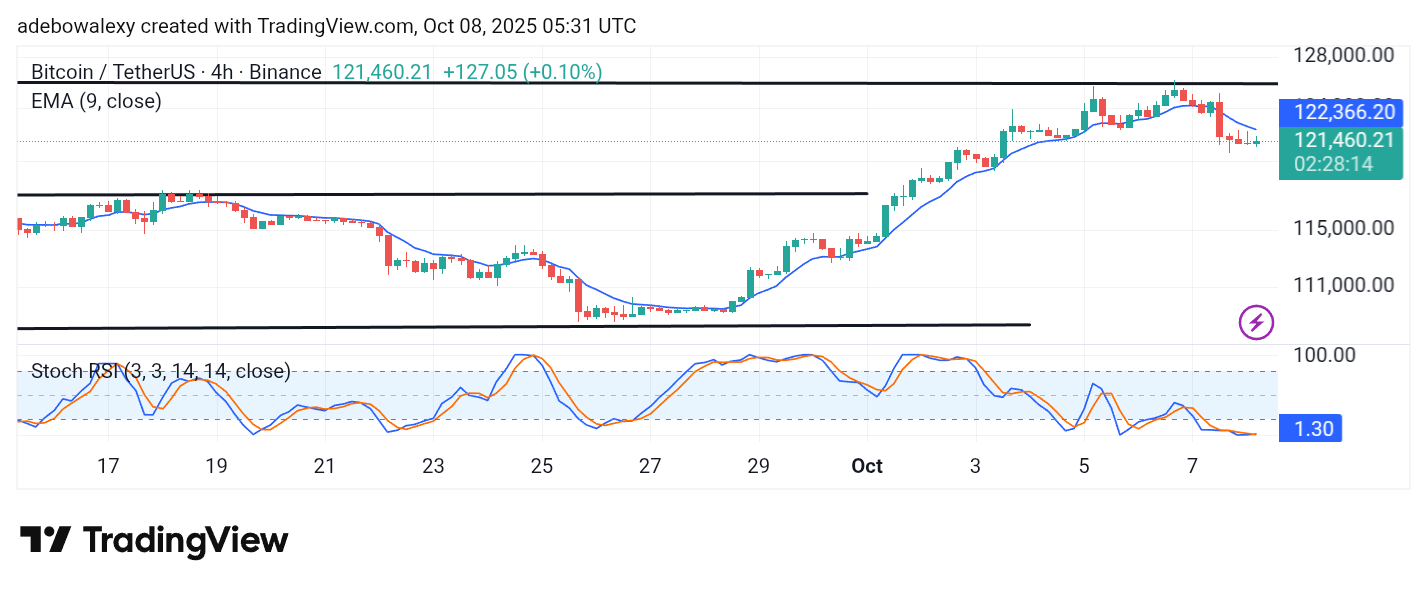
The ongoing session also reflects growing bullish strength, as seen in the more prominent green candle. However, price activity remains slightly below the 9-day EMA line.
The SRSI lines are currently merged in the oversold zone and moving sideways, suggesting that momentum is stabilizing. Traders may prefer to wait for price action to break above the 9-day EMA on this chart before entering long positions targeting the $125,000 level.