Bitcoin (BTC) Price Prediction: BTC/USDT Edges Strongly Toward the $117,000 Mark
Estimated Reading Time: 2 minutes
Don’t invest unless you’re prepared to lose all the money you invest. This is a high-risk investment and you are unlikely to be protected if something goes wrong. Take 2 minutes to learn more

Date: October 1, 2025
With the Uptober effect already influencing the crypto market, Bitcoin’s price action is also experiencing its own windfall from this seasonal trend. The latest price candle can be seen moving upward toward key levels, which may still imply further price increases.
BTC/USDT Long-Term Trend — Bullish (Daily Chart)
Key Price Levels
Resistance: $117,500, $120,000, $122,500
Support: $115,000, $112,500, $110,000
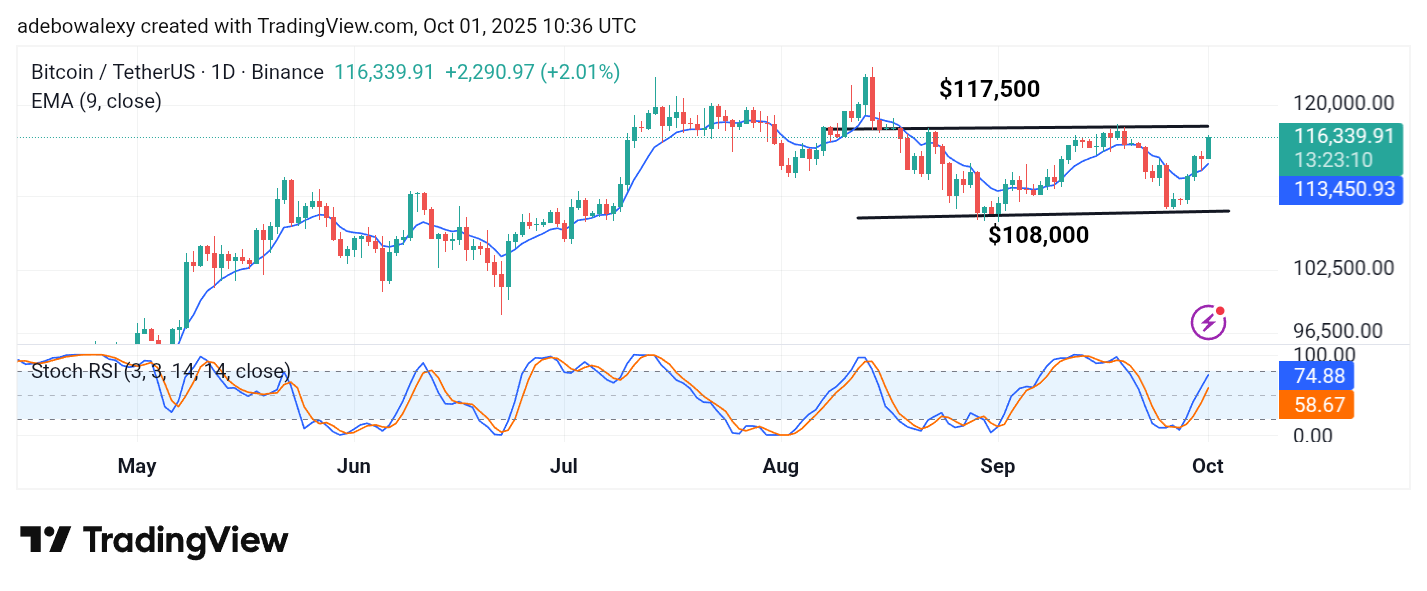
Price action in the Bitcoin daily market has been in the green since the last session. However, the ongoing session is represented by a much larger price candle than the one before it. Also, it now stands above the 9-day Exponential Moving Average (EMA) line. At the same time, the Stochastic Relative Strength Index (SRSI) has delivered an upward crossover, and its lines have continued upward into the overbought region of the indicator.
Bitcoin Price Prediction: BTC/USDT Retains an Upward Course
Price action in the Bitcoin daily market shows that bullish forces remain active. In particular, the current session’s price candle suggests that buying pressure is strong, thereby helping to retain most of the previously registered gains.
Furthermore, while a pullback is still possible, the market is holding up quite well. Also, the SRSI indicator lines are continuing their upward trajectory. Technically, this market remains aligned for more upside movement, as all indicators point to the likelihood of the market maintaining its upward course.
Bitcoin Price Prediction: BTC/USDT Keeps Bullish Momentum (4-Hour Chart)
Even on shorter market time frames, Bitcoin retains strong bullish characteristics. The ongoing session candle is positioned above the 9-day EMA curve and appears significantly larger than recent candles.
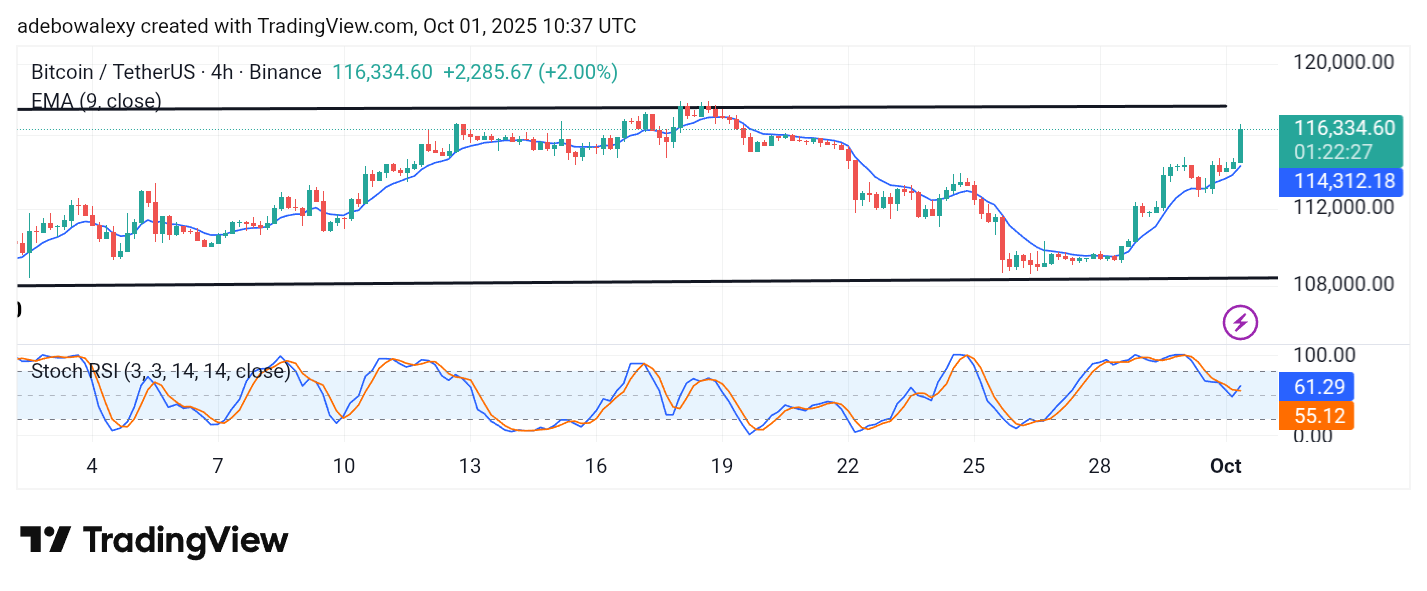
At the same time, the SRSI indicator has just delivered an upward crossover, which occurred above the 50 threshold. This is a bullish signal that suggests further upside potential. Technically, this implies that the upward movement in the market looks promising. Traders may consider targeting the $117,500 level for short-term gains.