Bitcoin (BTC) Price Prediction: BTC/USDT Falls to Lower Price Levels
Estimated Reading Time: 3 minutes
Don’t invest unless you’re prepared to lose all the money you invest. This is a high-risk investment and you are unlikely to be protected if something goes wrong. Take 2 minutes to learn more

Bitcoin (BTC) Price Prediction: October 23
The Bitcoin daily market has seen some considerable upside movement, with prices rising through the $68,000 threshold. The market has even moved on to test the $69,000 level. However, the market has currently retreated below the $68,000 threshold and is now hovering just above the $67,000 mark.
BTC/USDT Long-term Trend: Bearish (Daily Chart)
Key Price Levels:
Resistance: $68,000, $69,000, $70,000
Support: $67,000, $65,000, $60,000
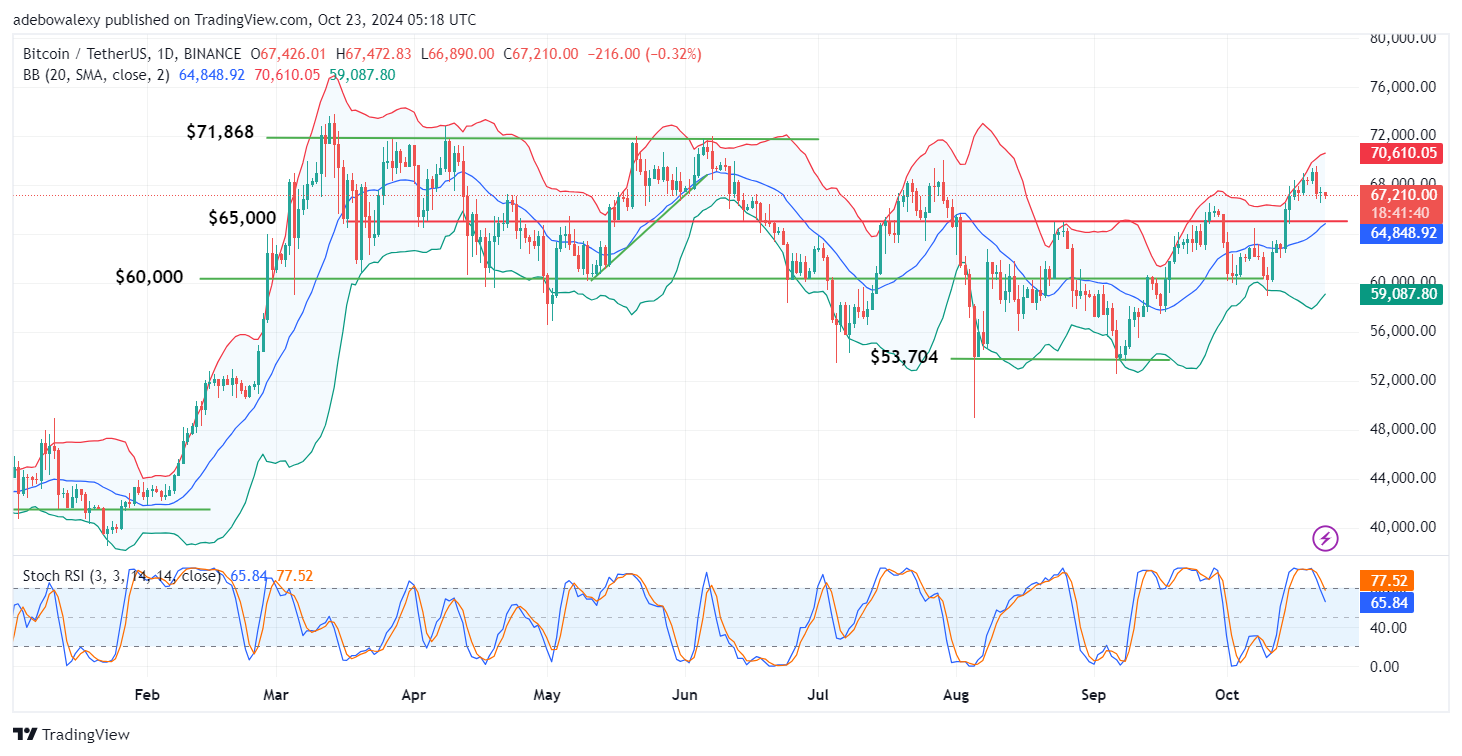
Headwinds have quickly plunged the market to the $68,000 price level, and as noted earlier, the market now hovers just above the $67,000 price mark. The last price candle on the chart is still red in appearance. However, it is considerably smaller than recent price candles. Be that as it may, Bitcoin still trades above the middle Bollinger Bands. Also, the Bollinger Bands indicator itself seems tilted in an upward direction. Meanwhile, the Stochastic Relative Strength Index (Stochastic RSI) lines can be seen plunging downward through the 80 level of the indicator.
Bitcoin (BTC) Price Prediction: BTC/USDT Stays Afloat
Based on the indications from the technical indicators on the daily chart, it can be seen that price movement in the Bitcoin market has faced rejection in its upward path. However, the downward rejection seems to have slowed as soon as price action fell below the $68,000 threshold.
Meanwhile, the fact that price action still lies above the middle Bollinger Bands hints that the current downward retracement may soon hit the brakes. Yet, the Stochastic RSI lines are still descending through the 80 mark of the indicator. Nevertheless, traders may anticipate an upward rebound soon.
Bitcoin (BTC) Price Prediction: BTC/USDT Consolidates Near the $67,000 Price Level (4-Hour Chart)
Price activity in the Bitcoin 4-hour market has started a consolidation move as it hovers near the $67,000 price mark. This consolidation move is occurring below the middle Bollinger Bands. Meanwhile, the Bollinger Bands themselves can now be seen oriented sideways. Similarly, the Stochastic RSI indicator lines are trending sideways in the oversold region.
Although the last price candle on the chart has appeared green, technical indicators are not indicating much positivity. Coupled with the fact that the market now trades below the middle Bollinger Bands, it seems that the market may test the psychological support at the $67,000 level, most likely for a breakthrough toward the $66,500 mark.