Litecoin (LTC) Price Prediction: LTC/USDT Witnesses a Sharp Downward Retracement
Estimated Reading Time: 3 minutes
Don’t invest unless you’re prepared to lose all the money you invest. This is a high-risk investment and you are unlikely to be protected if something goes wrong. Take 2 minutes to learn more

Litecoin (LTC) Price Prediction: October 22
Over the past few recent trading sessions, the Litecoin token has seen a considerable price increase. As a result, the market has risen past the $70.00 mark, and as of the time of writing, it still trades above the mentioned threshold despite the considerable downward retracement witnessed in the previous session.
LTC/USDT Long-term Trend: Bullish (Daily Chart)
Key Price Levels:
Resistance: $75.00, $80.00, $85.00
Support: $70.00, $65.00, $60.00
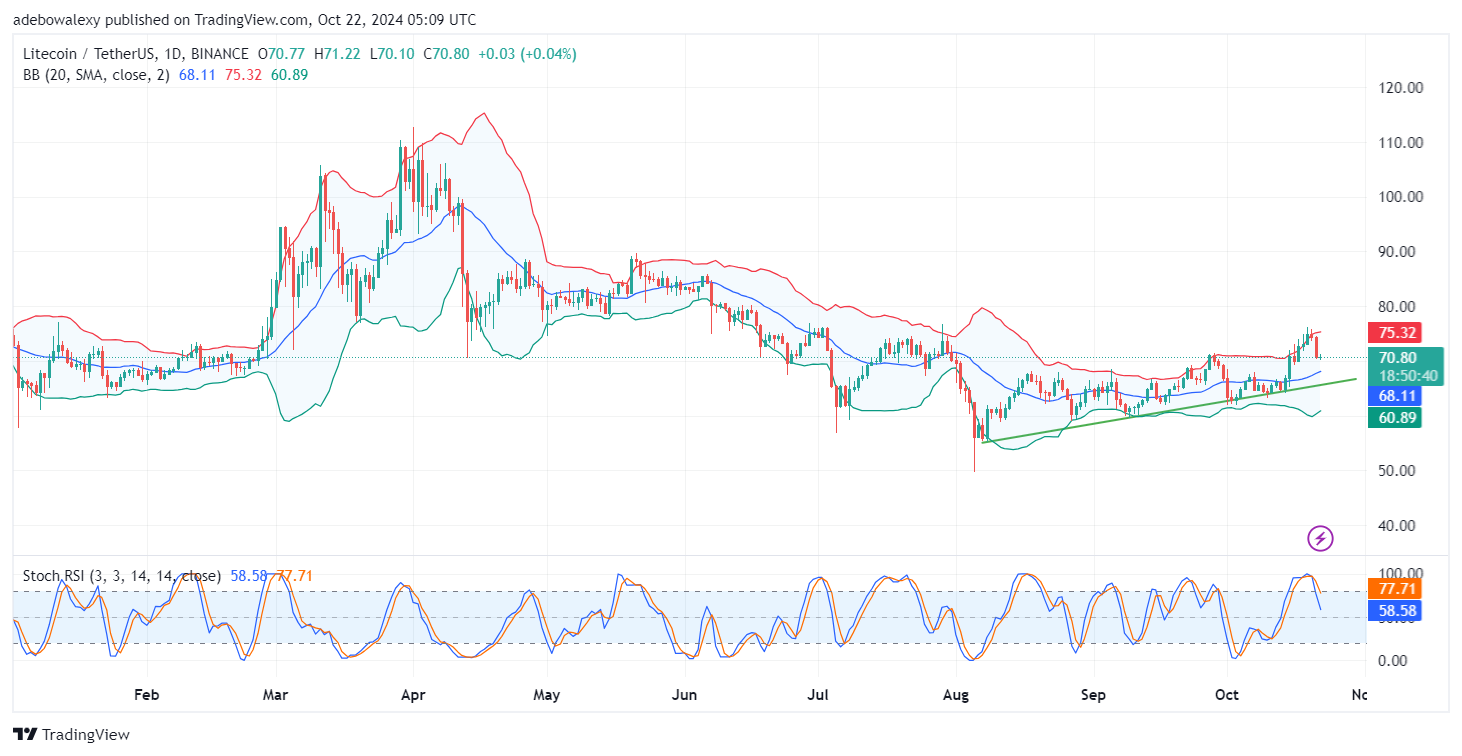
In the previous session, the Litecoin market dipped sharply. This plunged the market from around the $75.00 price level to nearly hit the psychological support at the $70.00 threshold level. The last price candle on the chart has appeared green but with a small body. Additionally, this is happening above the middle Bollinger Bands. Meanwhile, the Stochastic Relative Strength Index (Stochastic RSI) lines are falling steeply downward into the oversold region. The leading line of the indicator can be seen plunging considerably below the 80 mark and is now at the 58.89 level.
Litecoin (LTC) Price Prediction: LTC/USDT Buyers Are Trying to Break the Fall
While price action in the Litecoin daily market appears to have posted considerable losses, it seems buyers are trying to re-enter at the psychological level of $70.00. This conclusion is drawn from the appearance of the last price candle on the chart. Furthermore, this is occurring above the middle limit of the Bollinger Bands.
Additionally, the Bollinger Bands can still be seen as having a slightly upward-tilted trajectory. This is happening despite the downward trajectory of the Stochastic RSI lines, which can be seen plunging toward the 50 mark of the indicator. In addition, considering the fact that the market has been on a slight upward trend, it is logical to anticipate an upward rebound at the $70 mark.
Litecoin (LTC) Price Prediction: LTC/USDT Market Still Looks Challenged (4-Hour Chart)
In the Litecoin 4-hour chart, it can be seen that price activity is now below the middle band of the Bollinger Bands. In fact, price action has pushed the lower limit of this indicator. The last two price candles on the price chart can be seen proceeding in a sideways fashion. At the same time, the Stochastic RSI lines are now at their lowest in the oversold region, as they continue to drag sideways.
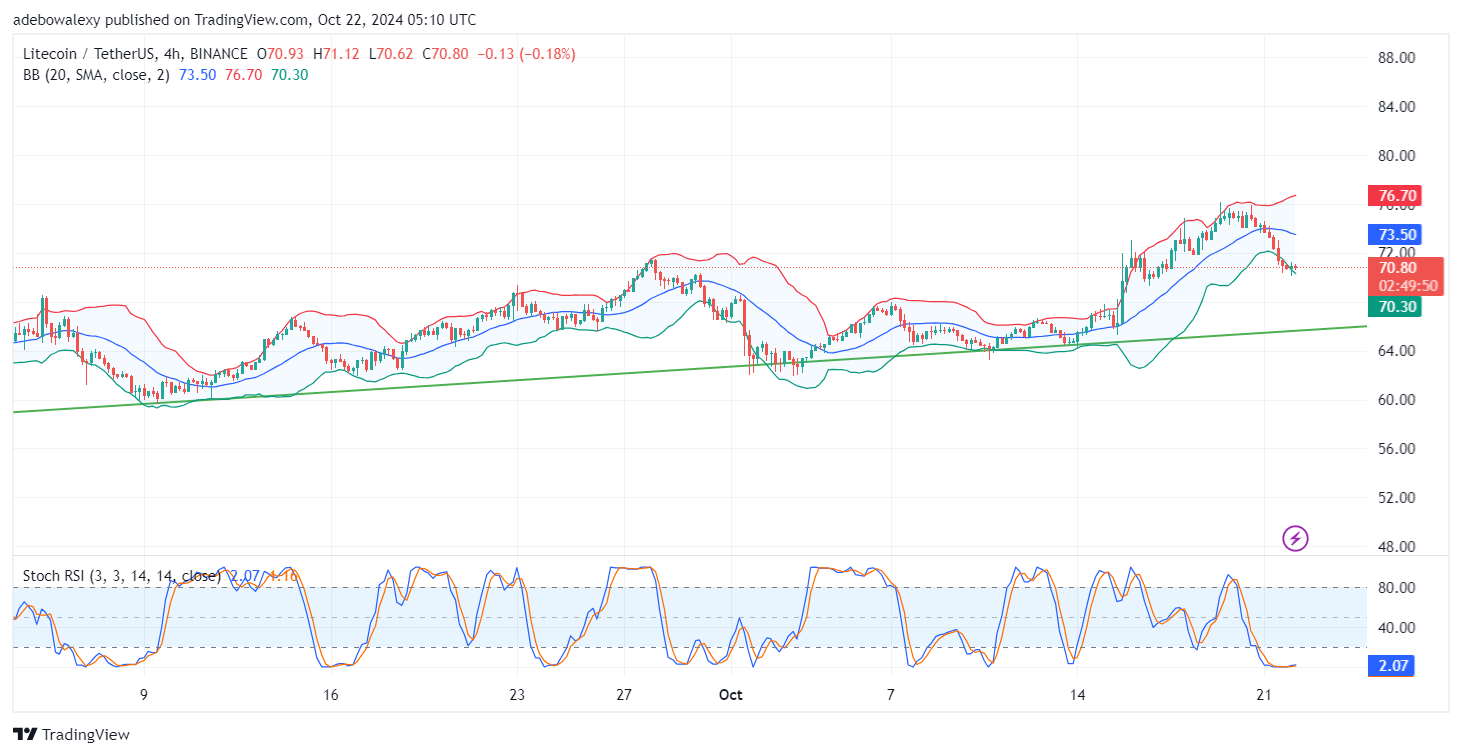
At the moment, this market seems depressed. This is expressed by the way price action proceeds sideways after testing the lower limit of the Bollinger Bands. The behavior of the Stochastic RSI too isn’t indicative of much optimism at the moment. Nevertheless, a rebound can be anticipated off the support at the $70.00 mark toward the $75.00 mark, considering the trend of the market over the past two months.