POL (ex-MATIC) Price Prediction: POL/USDT Consolidates Above $0.2100
Estimated Reading Time: 3 minutes
Don’t invest unless you’re prepared to lose all the money you invest. This is a high-risk investment and you are unlikely to be protected if something goes wrong. Take 2 minutes to learn more

POL (ex-MATIC) Price Prediction (March 22):
The POL (ex-MATIC) market has been unable to shake off bearish influences, keeping price action in a consolidation phase in recent sessions. However, one notable observation is that despite the overall decline in the crypto market, POL (ex-MATIC) has managed to hold above the $0.2000 support level.
POL/USDT Long-Term Trend: Bearish (Daily Chart)
Key Price Levels:
Resistance: $0.2500, $0.3000, $0.3500
Support: $0.2000, $0.1500, $0.1000
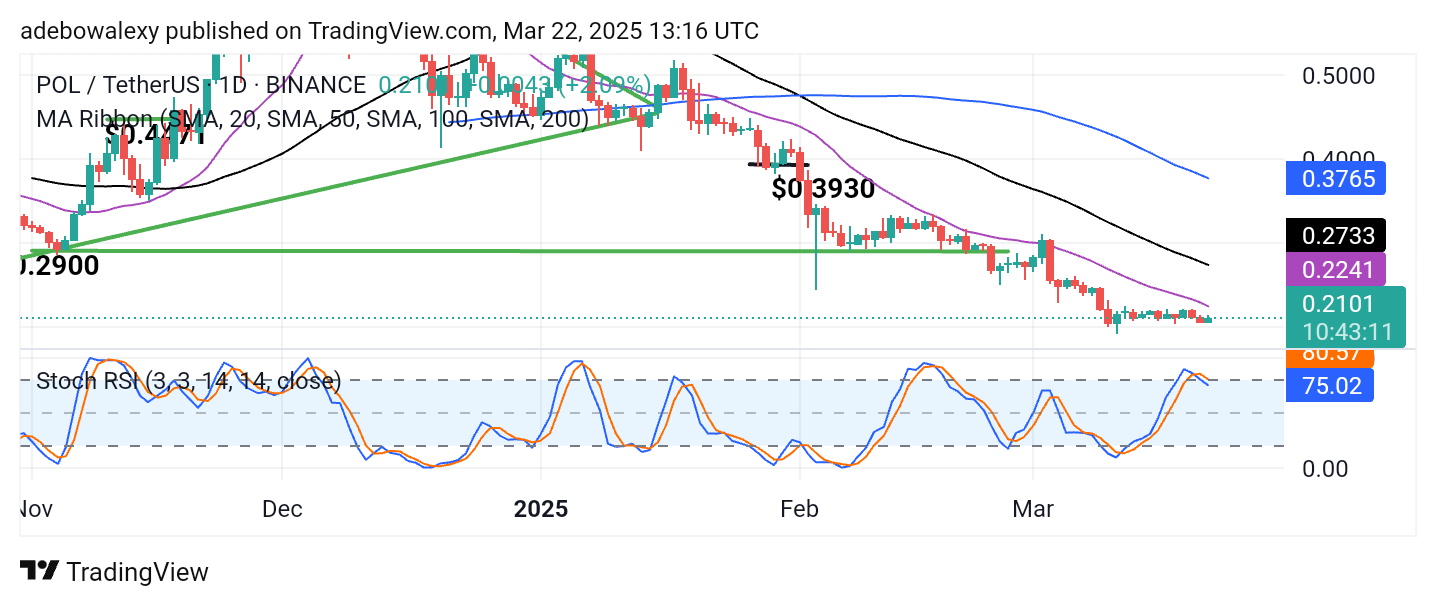
Price action has remained above the $0.2000 support level. The ongoing session has formed a green candle but with only minor gains. Additionally, price action remains below all the Moving Average (MA) lines, indicating persistent bearish pressure. Even though the market has struggled to gain meaningful upward momentum, the Stochastic Relative Strength Index (Stochastic RSI) has entered the oversold region and recently formed a bearish crossover. The indicator lines are now descending, suggesting that downside risks remain present.
POL (ex-MATIC) Price Prediction: POL/USDT Struggles to Attract Buy Interest
One key reason POL (ex-MATIC) remains under bearish pressure is the cautious sentiment among buyers in the broader crypto market. Since price action hit the $0.2000 support level, it has been consolidating.
As a result, trading activity in this market has remained below all the MA lines. The ongoing session has recorded only slight gains, keeping price action just above $0.2100 by a thin margin. Meanwhile, the Stochastic RSI lines are now falling toward the 70 level, indicating that the market is still not ready for significant bullish momentum.
POL (ex-MATIC) Price Prediction: POL/USDT Stays Below Key Levels (4-Hour Chart)
On the 4-hour chart, price action has rebounded from the resistance formed by the 20-day MA line. However, the subsequent downward movement has been minimal.
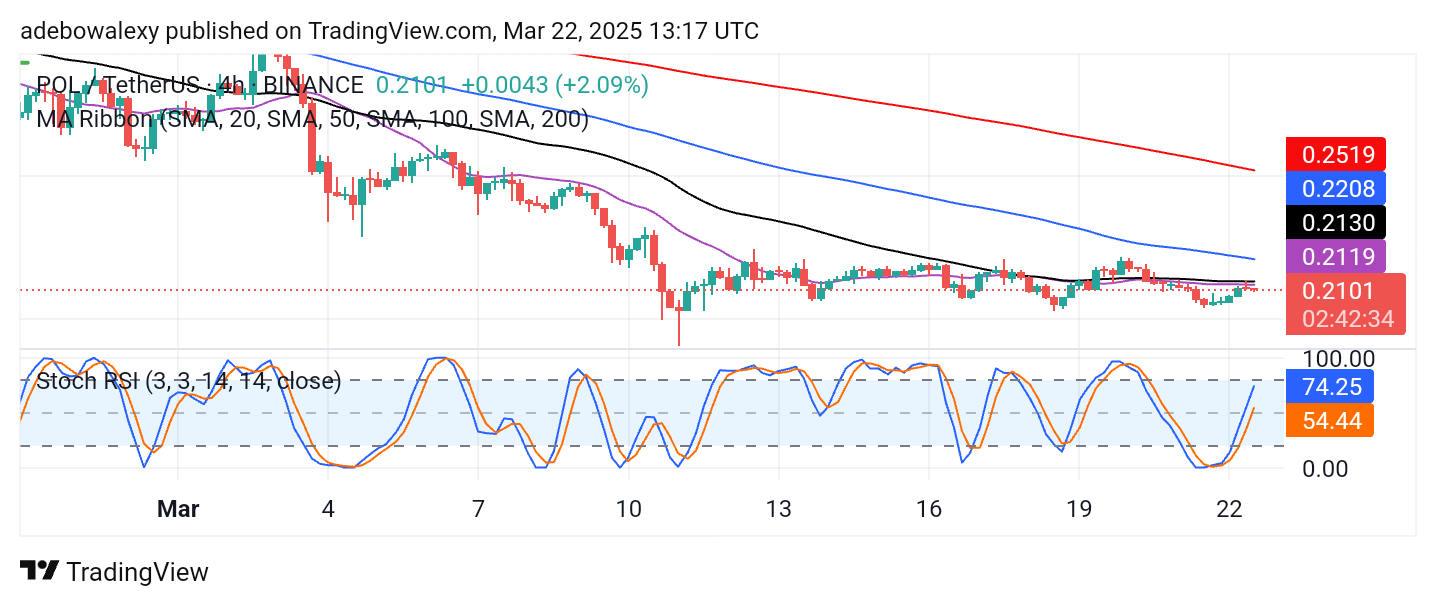
Meanwhile, the Stochastic RSI lines continue to rise despite the limited upward retracement. The rapid movement of the RSI suggests that this market may not sustain significant gains. Therefore, traders should adopt a cautious approach, as any developing bullish retracement will likely face strong bearish resistance. Given the current conditions, targeting the $0.2200 price level seems like a realistic objective.