Solana (SOL) Price Prediction: SOL/USDT Remains Generally Weak
Estimated Reading Time: 3 minutes
Don’t invest unless you’re prepared to lose all the money you invest. This is a high-risk investment and you are unlikely to be protected if something goes wrong. Take 2 minutes to learn more
Solana Price Prediction: March 21
The Solana market hasn’t recorded many gains in recent sessions. Consequently, the market remains below important technical landmarks. Additionally, price action has moved sideways since testing support at the $120 baseline. Let’s analyze how this may evolve further below.
SOL/USDT Long-Term Trend: Bearish (Daily Chart)
Key Price Levels
Resistance: $130, $150, $170
Support: $120, $100, $80
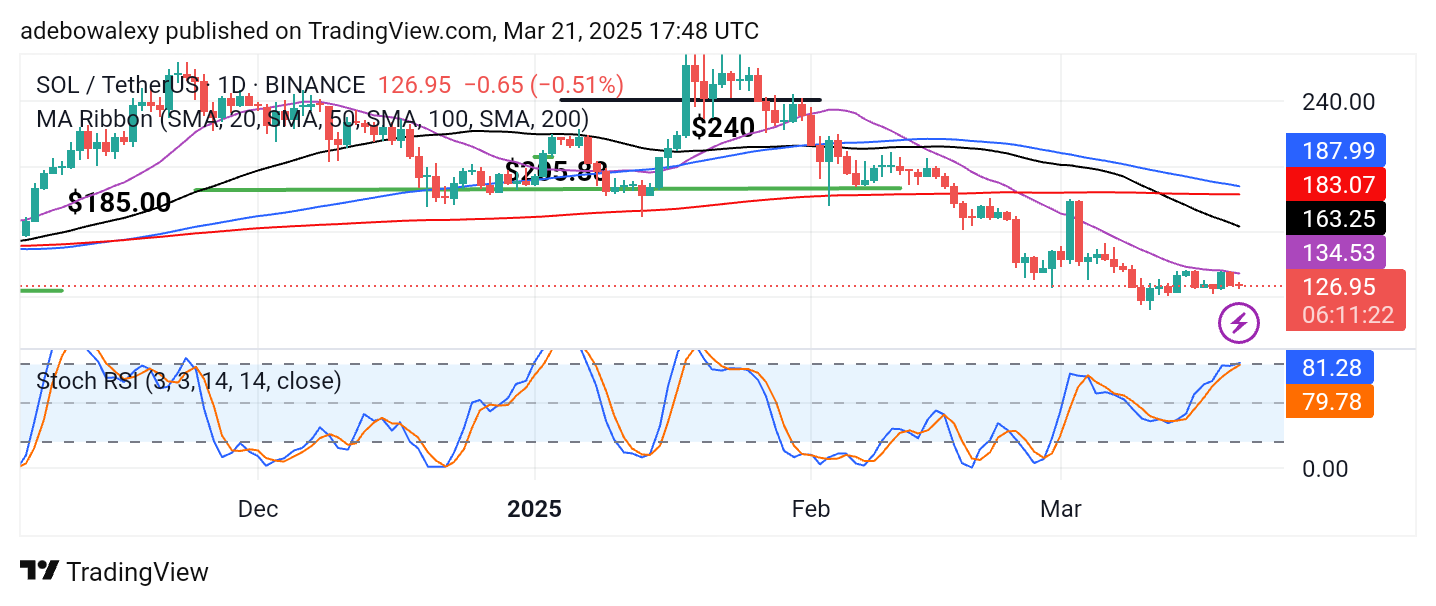
The ongoing session in the Solana daily market has appeared bearish, with price action trading below all the Moving Average (MA) lines. However, the price remains above the $120 support level. Additionally, the corresponding price candle for the current session appears small, indicating indecision in the market.
The Stochastic RSI lines have an upward trajectory but appear to have converged around the 80 level of the indicator, signaling a potential trend reversal.
Solana Price Prediction: SOL/USDT Holds Above the $120 Threshold
Price action in the Solana daily market remains under strong bearish influence. Since mid-January, price movement has transitioned from one support level to another. Most recently, it tested the $120 support. However, bearish pressure has not been strong enough to breach this level, leading to consolidation above it.
The current session’s price candle appears red, with its shape and size suggesting a battle between buyers and sellers. The Stochastic RSI lines remain positioned upward but have converged near the 80 level, indicating a potential reversal. Based on these signals, price action remains under strong bearish pressure.
Solana Price Prediction: SOL/USDT Stays Grounded (4-hour Chart)
The last price candle on this chart appears green and takes the shape of a small hammer, a potential bullish signal. However, it remains below all Moving Average (MA) lines, suggesting that downward forces are still dominant.
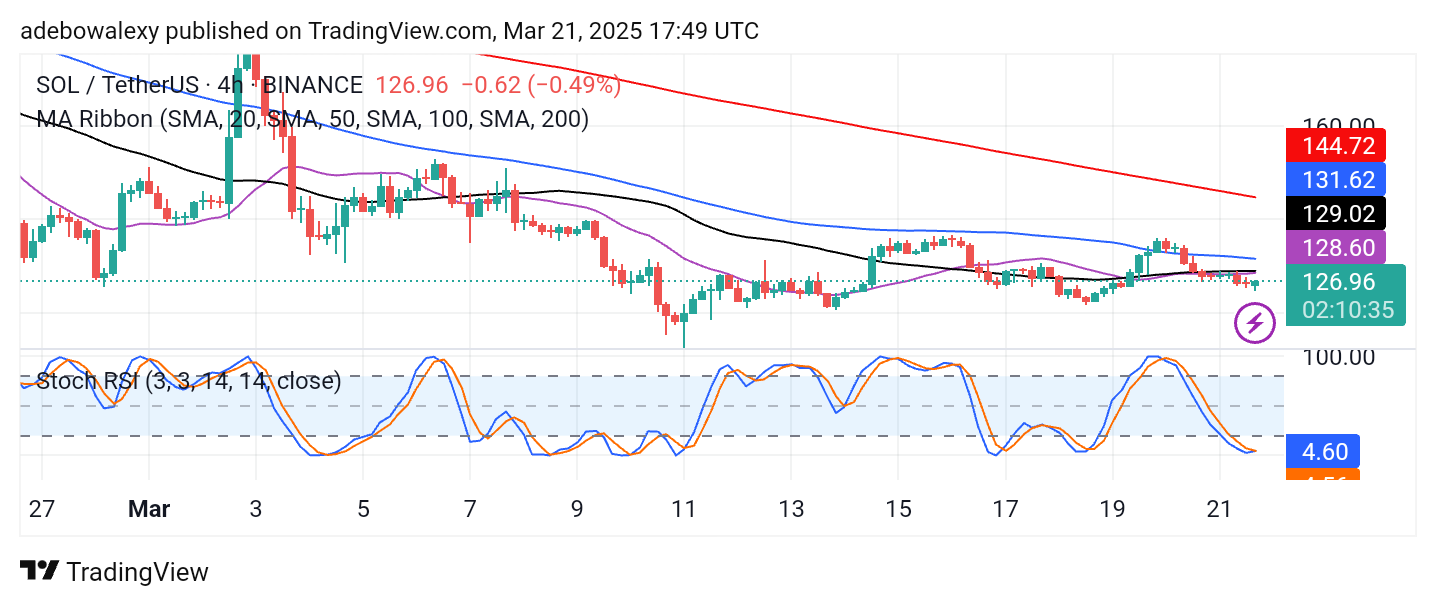
Additionally, the Stochastic RSI indicator lines have converged for a crossover deep in the oversold region, aligning the market for a possible short-term rebound. While the overall market sentiment remains bearish, these signals suggest that upside forces may gain momentum if buying pressure increases. Nevertheless, traders may look for a retest of the $120 price level.

