Ethereum (ETH/USDT) Signals a Pullback After a Prolonged Uptrend
Estimated Reading Time: 3 minutes
Don’t invest unless you’re prepared to lose all the money you invest. This is a high-risk investment and you are unlikely to be protected if something goes wrong. Take 2 minutes to learn more
Ethereum Long-term Analysis: Bullish
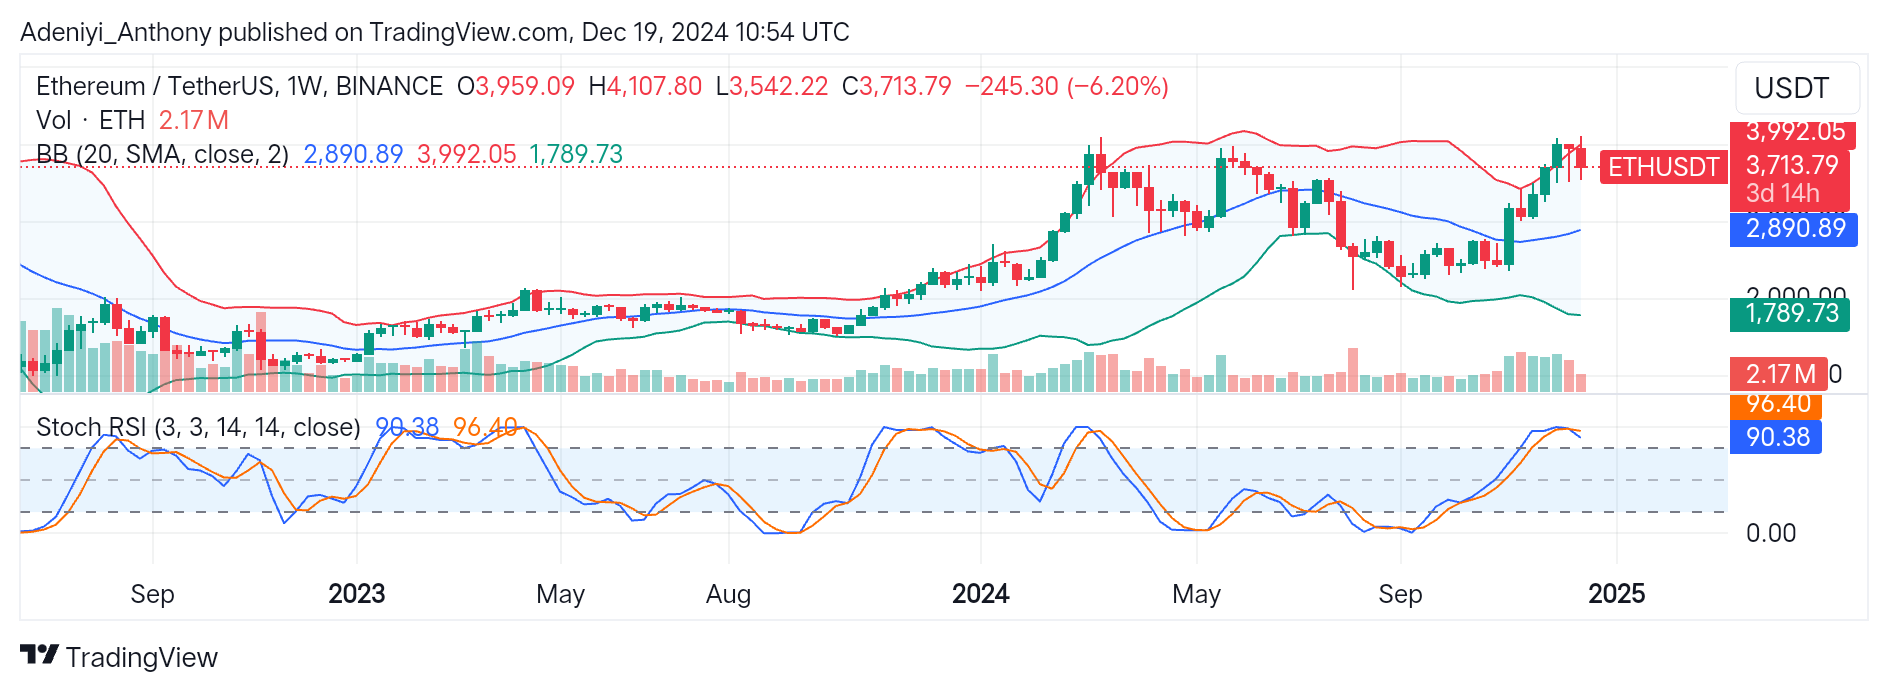
The market for Ethereum against Tether is currently facing a correction after an overextended rally above $4,100. The weekly chart for the pair shows that there has been a bullish trend with a persistent aim for new heights since late 2023. However, current price action suggests a potential pullback to $3,542 might be near.
Recently, the price of Ethereum extended above $4,000, after which the formation of the next candlestick signals a short correction. However, it seems the current move lacks strong conviction, as seen in the moderate weekly trading volume.
Currently, Ethereum is trading at $3,713.79, with a 6.20% decline from the previous trading session.
Technical Indicators
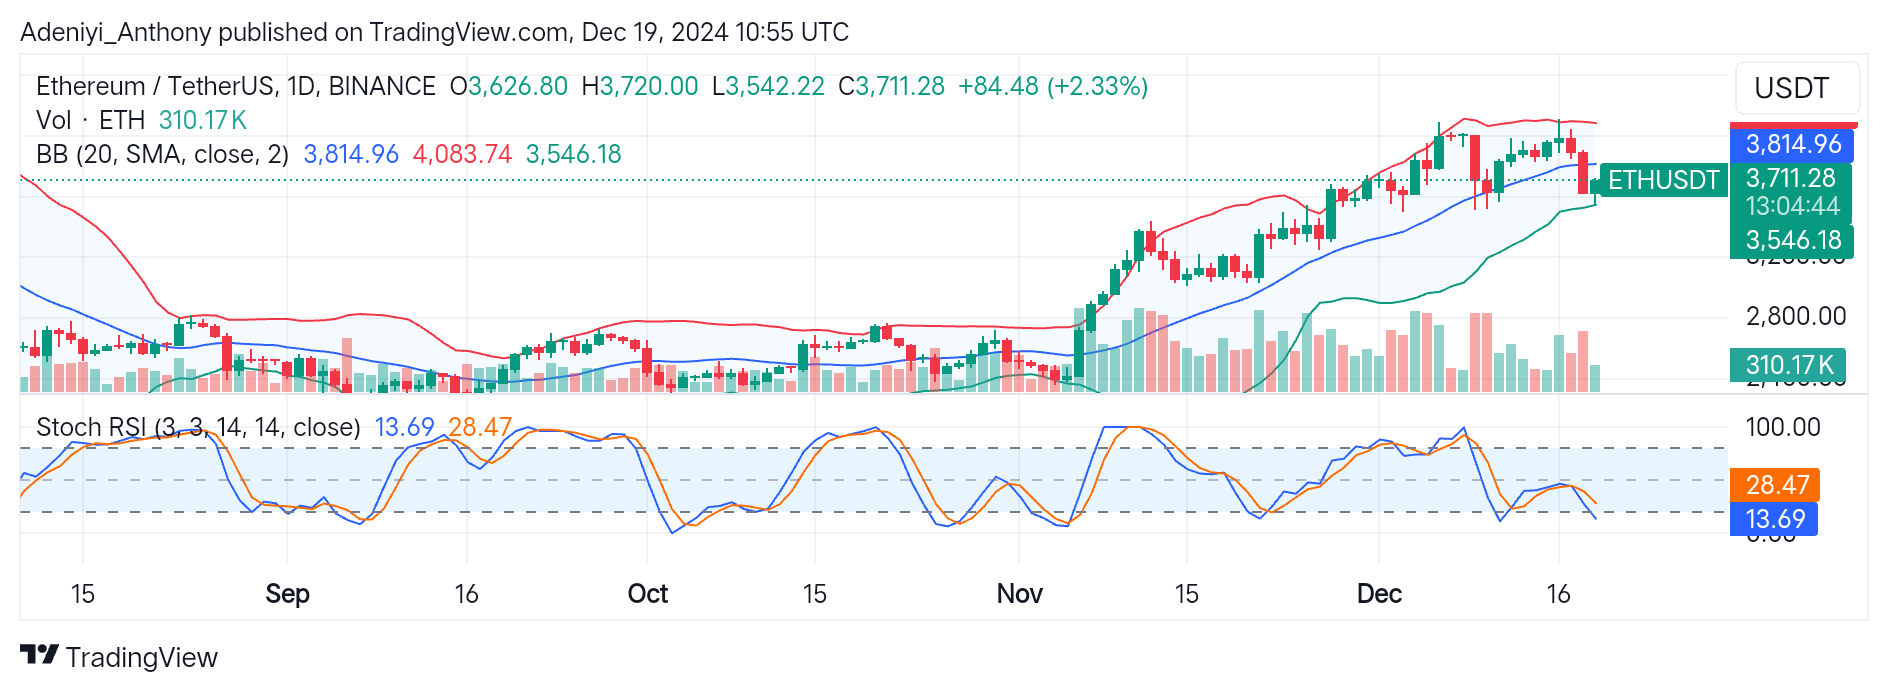
Major Resistance Levels: $3,992.05, $4,107.80, and $4,500
Major Support Levels: $3,542.22, $2,890.89, and $1,789.73
Ethereum Technical Analysis
The analysis of Ethereum against the USDT on a weekly timeframe shows that the pair is currently overbought as seen in the price actions around the upper Bollinger band and the positioning of the Stochastic lines. However, the current dip lacks the traders’ support. Therefore, a spike in volume would confirm either a breakout or breakdown.
Therefore, a breakout towards $4,500 will be seen if the pair’s price closes above the $3,992 level. conversely, a dip below $3,542.22 would push the price down to $2,890.89.
ETH/USDT Analysis: A Recovery or Continued Downtrend?
On the daily timeframe, ETH/USDT’s price action shows early signs of recovery after finding support at the lower Bollinger band. However, the Stochastic oscillator suggests an oversold condition with a reversal attempt. Therefore, a spike in the trading volume beyond the daily $310.17k might fully change the direction of the lines.
Till then, traders should watch price action for a breakout above the midline at $3,814.96 or rejection for range-bound activities at the same level.
You can purchase crypto coins here. Buy LBlock