Polkadot (DOT/USDT) Positioned for More Upside Gains
Estimated Reading Time: 3 minutes
Don’t invest unless you’re prepared to lose all the money you invest. This is a high-risk investment and you are unlikely to be protected if something goes wrong. Take 2 minutes to learn more
Polkadot Long-term Analysis: Ranging
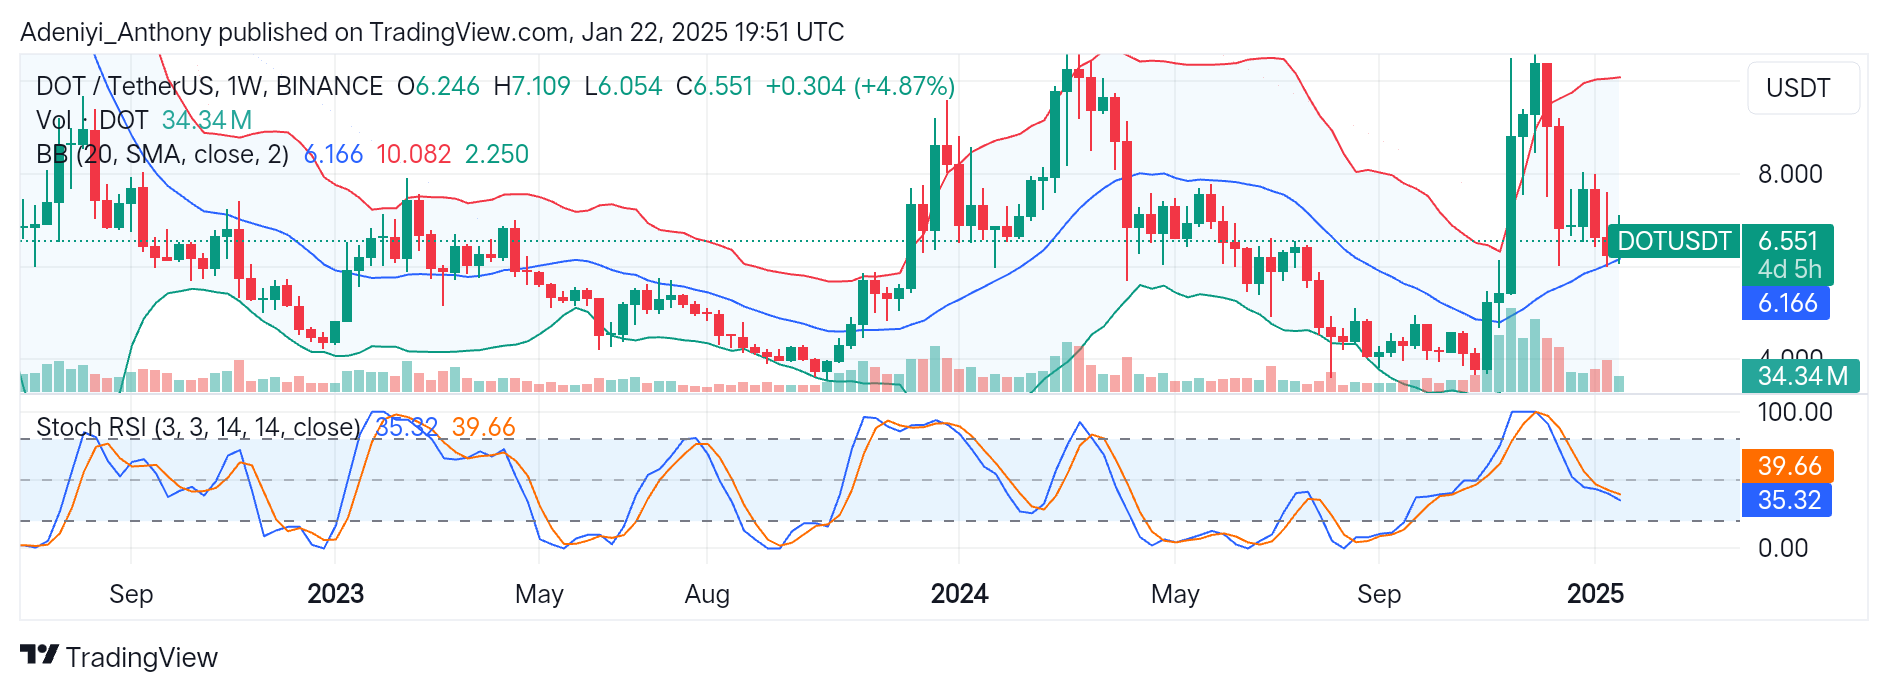
The market for Polkadot against the Tether has experienced an upward momentum, breaking above previous resistance at around $6.200. The current price movement shows a 5% weekly gain after experiencing a minor dip in previous sessions.
However, the Bollinger bands suggest strong impending volatility in the near session, while the Stochastic oscillator signals a cool-off for the pair. This set-up shows a cautiously optimistic market with expectations of further upward momentum if DOT/USDT maintains its current trajectory.
Currently, Polkadot trades at $6.551 with a 4.87% weekly gain.
Technical Indicators
Major Resistance Levels: $7.100, $7.500, and $8.000
Major Support Levels: $6.166, $6.000, and $5.500
Polkadot Technical Analysis
The analysis of Polkadot against the Tether on the weekly timeframe shows that the pair suspends above the mid-band at $6.166 while moving close towards the upper band at $10.082. However, the Bollinger Bands indicate increased volatility, signaling further gains, while a rejection at the current level might result in consolidation.
On the other hand, the Stochastic RSI suggests more room for an upward movement if momentum builds. However, to avoid significant sell-offs, the volume bar must be monitored.
To this end, a break above $7.000 would indicate a continued uptrend; otherwise, a break below $6.150 would signal a short-term dip.
DOT/USDT Analysis: What’s Next?
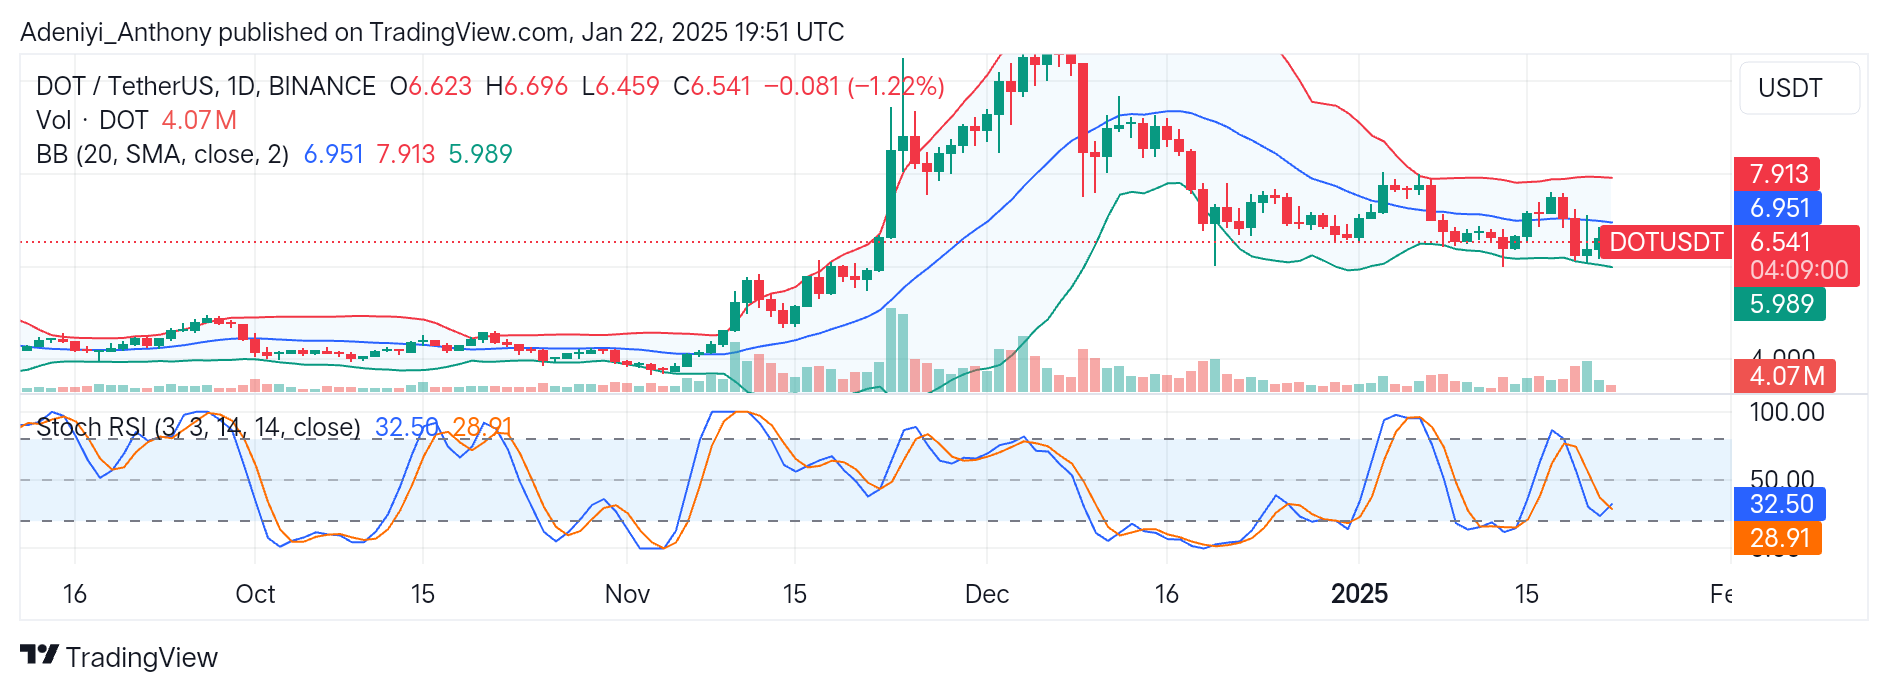
The analysis of DOT/USDT on the daily timeframe shows that the price has retraced by 1.22%. This reflects a neutral sentiment as the bulls and bears fight for market dominance, with price hovering around the lower Bollinger bands, showing a potential breakout ahead.
Also, the Stochastic RSI shows that the pair is in the oversold region, pointing to the North, suggesting a possible rebound in the near term.
To this end, DOT needs more bullish participants to push the price above $6.950 to regain momentum, while a break below $6.000 would indicate further downside.
You can purchase crypto coins here. Buy LBlock