Polkadot Falls to $3.60 as Bears Continue to Descend
Don’t invest unless you’re prepared to lose all the money you invest. This is a high-risk investment and you are unlikely to be protected if something goes wrong. Take 2 minutes to learn more

Polkadot (DOT) Long-Term Analysis: Bearish
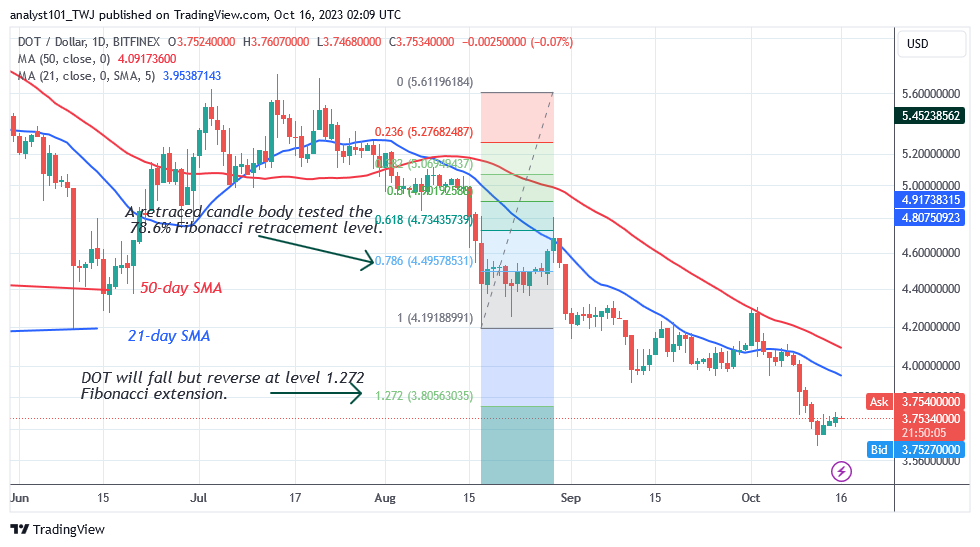
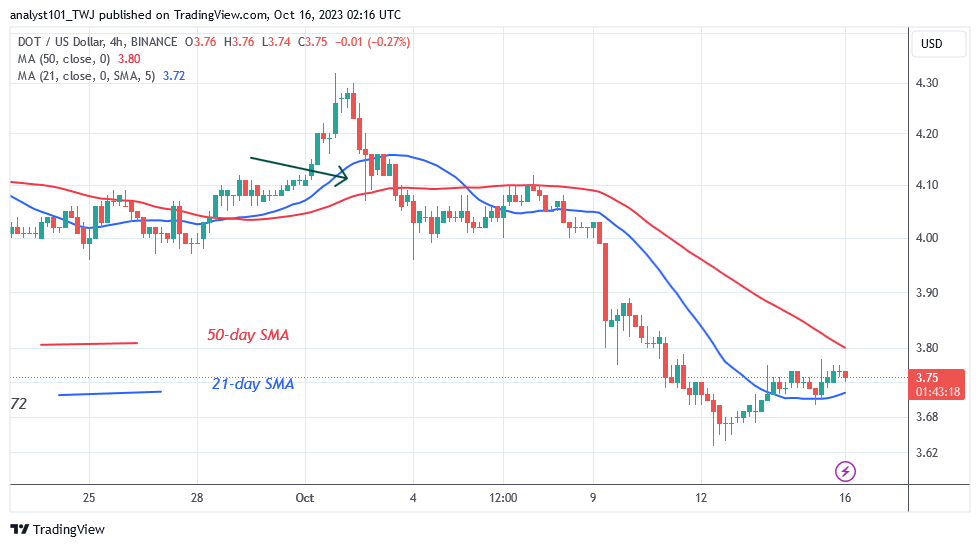
Polkadot’s (DOT) price is falling and has broken through the current support level of $3.80 as bears continue to descend. The cryptocurrency’s price broke through the current support level to reach a low of $3.62. The bulls then purchased the dips as the altcoin soared and rested at the $3.80 high, which is currently a resistance level.
Polkadot is fluctuating between $3.60 and $3.80 in price. If the current support is breached, the altcoin will fall much deeper to $3.50. The altcoin will cross above the moving average lines if it recovers over the $3.60 support level. The upward momentum will continue until the price reaches $4.40 or $4.60.
Technical indicators:
Major Resistance Levels – $10, $12, $14
Major Support Levels – $8, $6, $4
Polkadot (DOT) Indicator Analysis
On October 16, the price bar retested the 21-day SMA, causing the cryptocurrency to fall even more. When the price bars are above the moving average lines, the crypto’s price will rise. The moving average lines are pointing downward, indicating that the downturn is ongoing.
What Is the Next Direction for Polkadot (DOT)?
Polkadot is now available in a new price range of $3.60 to $3.80 as bears continue to descend. The resistance at $3.90 hampered the rise on October 16. The altcoin is dropping in value and is approaching the $3.60 mark. If the current support holds, the sideways movement will continue in the current price range.
Otherwise, if the current support level is breached, the downturn will resume.
You can purchase Lucky Block here. Buy LBLOCK
Note: Cryptosignals.org is not a financial advisor. Do your research before investing your funds in any financial asset or presented product or event. We are not responsible for your investing results
