Polkadot Tumbles as It Retests the $3.80 Low
Estimated Reading Time: 2 minutes
Don’t invest unless you’re prepared to lose all the money you invest. This is a high-risk investment and you are unlikely to be protected if something goes wrong. Take 2 minutes to learn more

Polkadot (DOT) Long-Term Analysis: Bearish
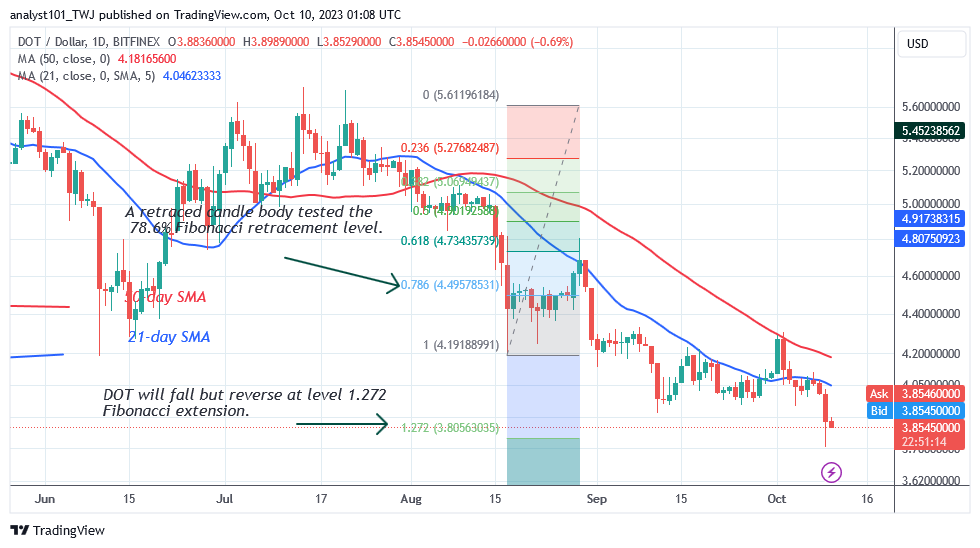
Polkadot’s (DOT) price is getting close to the bottom of the chart as it retests the $3.80 low. The rejection at the 50-day SMA allowed for the present drop. The DOT price rose above the moving average lines on October 1 but was halted by the resistance at $4.30 or the 50-day SMA. Polkadot is currently trading at a low of $3.85.
The price indicator predicts that the market will decline to a low of $3.80 before turning around. DOT/USD is now trading at the bottom of the chart. The oversold area of the market is where the cryptocurrency is trading. Most often, buyers are anticipated to appear in the oversold area to drive prices higher.
Technical indicators:
Major Resistance Levels – $10, $12, $14
Major Support Levels – $8, $6, $4
Polkadot (DOT) Indicator Analysis
The downward slope of the moving average lines indicates a downturn. The price bars were before trapped by the moving average lines that permit priceaility in a range. Since the price bars are currently below the moving average lines, further decline is permitted. The coin is oversold, thus the present slide is probably going to stop.
What Is the Next Direction for Polkadot (DOT)?
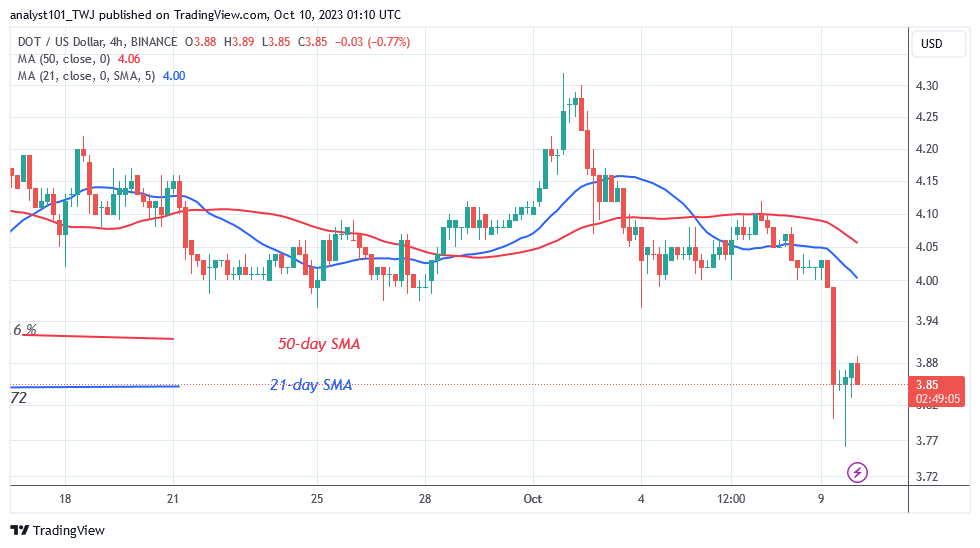
Polkadot is in a fresh decline as it retests the $3.80 low.The decrease was predicted to go as low as $.80, but as of the time of writing, it has fallen as low as $3.85. The coin is heavily oversold in this area. The market dropped to a low of $3.76 in the shorter time frame before turning around. The crypto asset is tumbling to test the $3.80 support once more before turning around.
You can purchase Lucky Block here. Buy LBLOCK
Note: Cryptosignals.org is not a financial advisor. Do your research before investing your funds in any financial asset or presented product or event. We are not responsible for your investing results