Bitcoin Cash (BCH/USD) Price Holds at a 14-day SMA Bearish Path
Estimated Reading Time: 3 minutes
Don’t invest unless you’re prepared to lose all the money you invest. This is a high-risk investment and you are unlikely to be protected if something goes wrong. Take 2 minutes to learn more

Free Crypto Signals Channel
Bitcoin Cash Price Prediction – February 11
The BCH/USD price holds at a 14-day SMA bearish path, following a sequential less-active recovery moving motions. Over a couple of fewer hours back, the crypto economy has been trading between the high and low points of $342 and $333 at an average percentage rate of 1.50 negatives.
BCH/USD Market
Key Levels:
Resistance levels: $400, $450, $500
Support levels: $250, $200, $150
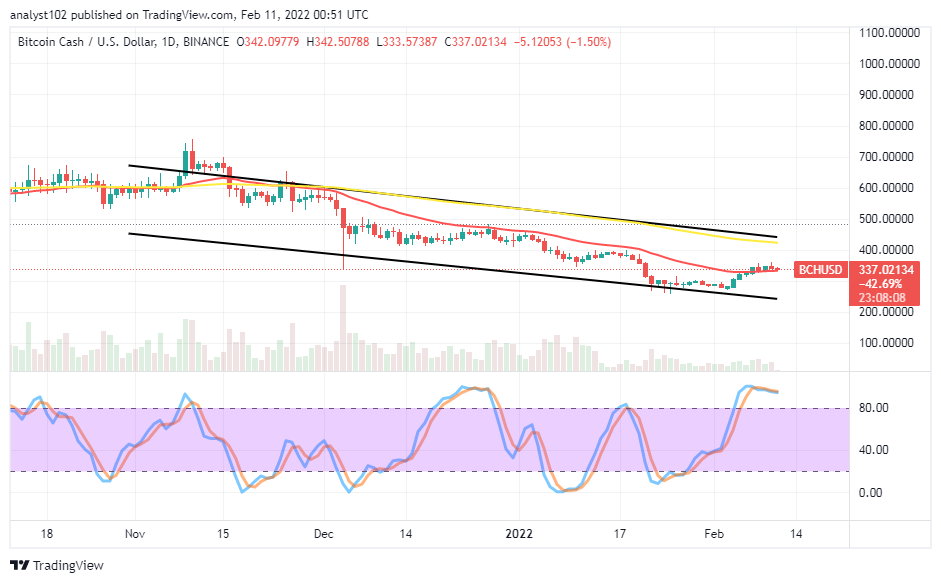
BCH/USD – Daily Chart
The BCH/USD daily chart reveals the crypto-economic price holds at a 14-day SMA bearish path to signify the possibility of seeing less-active northward upsurges in the subsequent sessions. The upper bearish trend line drew alongside the 50-day SMA above the $400 resistance level over the 14-day SMA, which is a bit above the $300 level. The Stochastic Oscillators are in the overbought region, slightly clogging their lines southbound within to indicate the probable trading event of the crypto’s valuation declining against the US economy afterward.
As BCH/USD price holds at a 14-day SMA bearish path, will the crypto economy surrender soon lose to the downside?
It appears that some indicators suggest the BCH/USD market will soon surrender, losing to the downside as the crypto-economic price holds at a 14-day SMA bearish path. Given that, it would be psychologically ideal that exertion of buying order positions postponed for a while. Price needed to form a trading pattern at a lower trading zone, showing that support has gotten before launching a long order.
On the downside of the technical analysis, the BCH/USD market short-position takers may now have to brace up for spotting a sell position entry while price tends to make a powerful motion. The reading of the Stochastic Oscillators in the overbought region gives a firm stance that the crypto economy is most liable to succumb to a valuation-downturn moving process in the near time.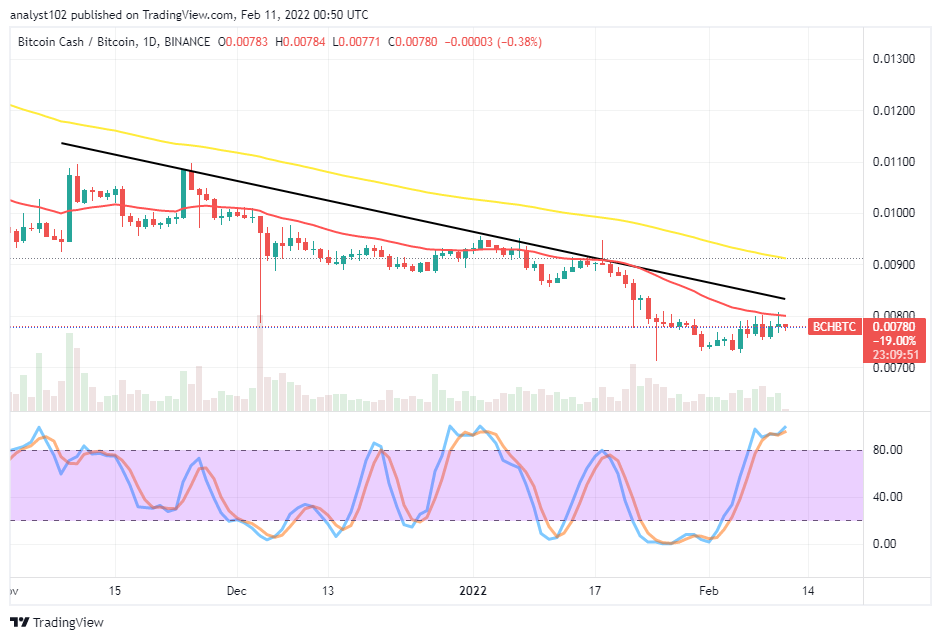
BCH/BTC Price Analysis
In comparison, Bitcoin Cash, yet trends under depressions inflicted by Bitcoin. In other words, the cryptocurrency pair price holds at a sell signal side of the smaller SMA. The 50-day SMA trend line is above the 14-day SMA trend line. The Stochastic Oscillators are in the overbought region. And they have conjoined their lines within it to indicate that the base crypto may in no time start to give in to a falling motion as paired with the flagship counter-trading crypto.
Note: Cryptosignals.org is not a financial advisor. Do your research before investing your funds in any financial asset or presented product or event. We are not responsible for your investing results.
You can purchase crypto coins here. Buy Tokens