Uniswap (UNI) Price Prediction: UNI/USDT Resumes Trading Above the $6.50 Price Mark
Estimated Reading Time: 3 minutes
Don’t invest unless you’re prepared to lose all the money you invest. This is a high-risk investment and you are unlikely to be protected if something goes wrong. Take 2 minutes to learn more

Uniswap Price Prediction: March 20
Most cryptocurrencies have retested higher price levels in response to Bitcoin’s bullish momentum. One of these coins is Uniswap (UNI), which has resurfaced above the $6.50 price level. Although the market is facing some immediate challenges, it may subsequently resume its upward retracement.
UNI/USDT Long-Term Trend: Bearish (Daily Chart)
Key Price Levels:
Resistance: $7.00, $8.00, $10.00
Support: $6.00, $5.50, $4.50
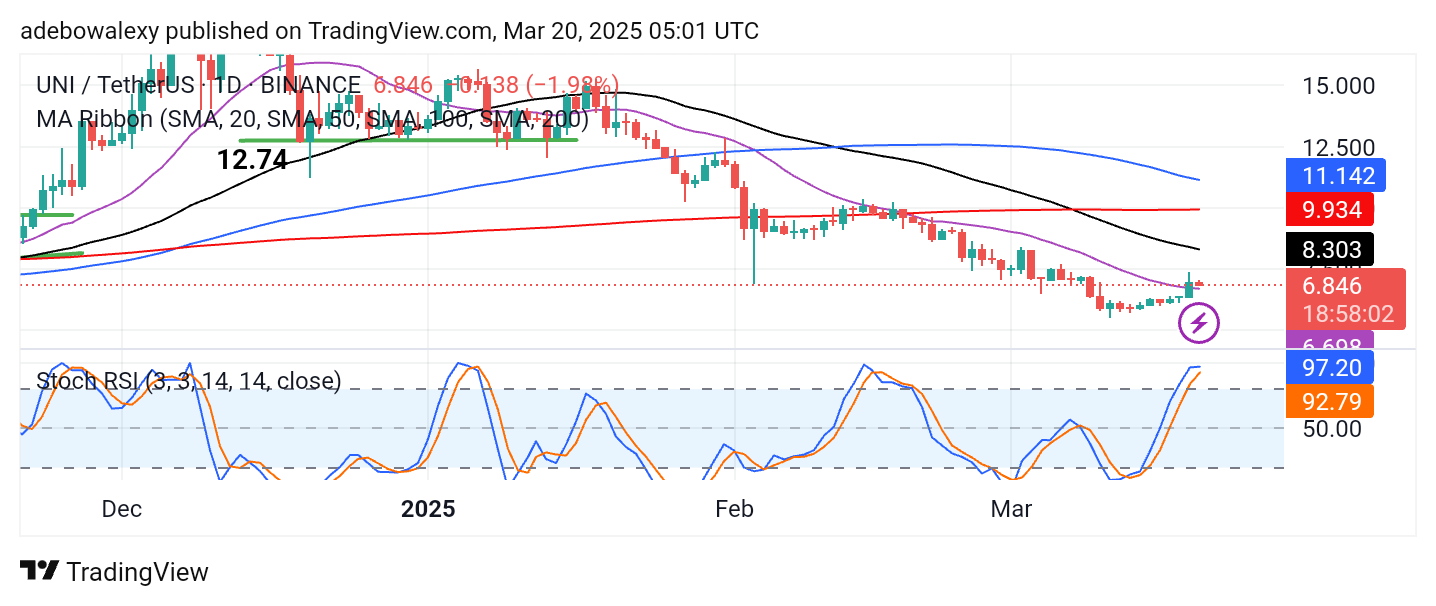
The Uniswap market recorded a notable price movement in the previous session, bringing the market to test the $7.00 threshold. However, this price level appears to be a formidable resistance. As a result, the ongoing session has turned bearish, although UNI continues to trade above the 20-day moving average (MA) curve.
Meanwhile, the Stochastic Relative Strength Index (RSI) indicator lines are already in the overbought region, showing a deflection on the lead line
Uniswap Price Prediction: UNI/USDT Stays Afloat
While the Uniswap market has shown signs of life, mechanical indicators suggest that price action has limited bullish momentum. The price has only risen past the 20-day MA line, with other MA lines still ahead. Additionally, the only candle price above the 20-day MA is red, indicating that downward pressure is dominant.
Moreover, the Stochastic RSI lines are already in the overbought region. Given this, it appears that the movement of the Stochastic RSI has been too rapid, suggesting that any upside retracements may not be significant.
Uniswap Price Prediction: UNI/USDT Pulls Back After Testing the $7.00 Threshold (4-Hour Chart)
In the 4-hour chart, it is evident that Uniswap (UNI) has rebounded off the $7.00 price ceiling. The downward retracement has continued for a second consecutive session. However, the ongoing session remains above most of the MA lines.
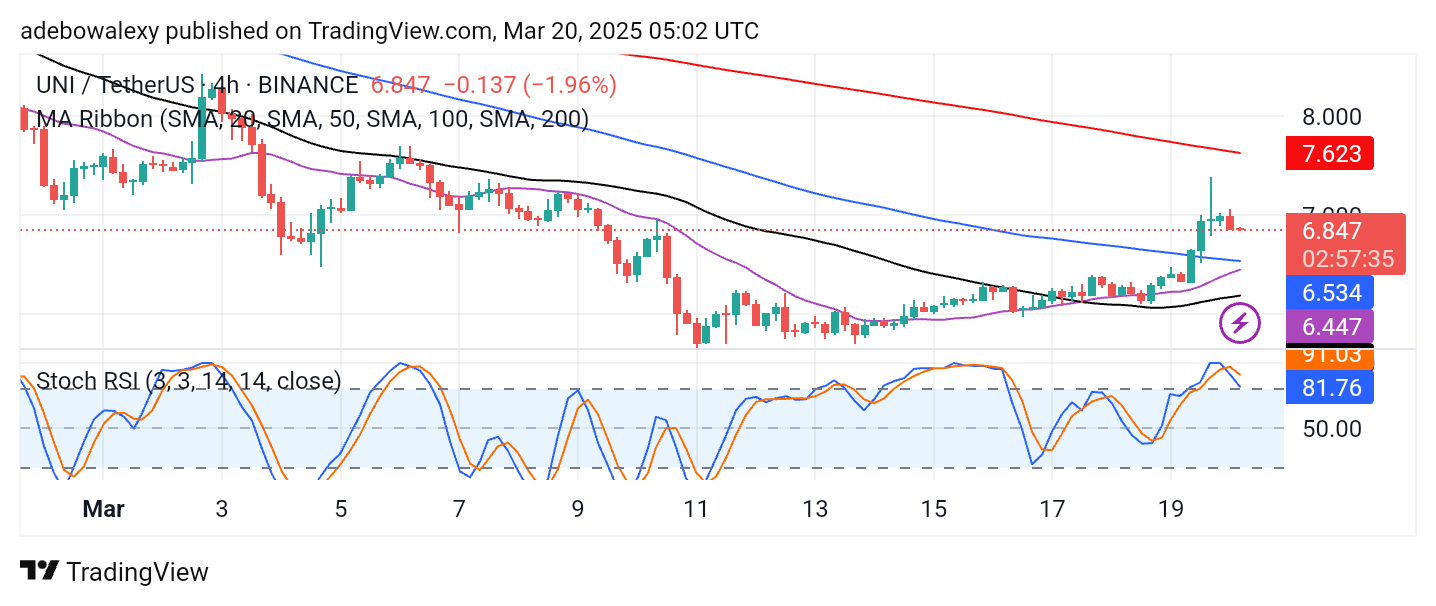
Additionally, the 20-day and 100-day MA curves appear to be converging, which could lead to a crossover below price action. If this occurs, it may strengthen the possibility of an upward retracement.
Meanwhile, the Stochastic RSI lines fall toward the indicator’s 80 mark. Given this, traders may anticipate an upward rebound of the $6.534 support level