Bitcoin (BTC) Price Prediction: BTC/USDT Slightly Ascends Above $80,000 Threshold
Estimated Reading Time: 2 minutes
Don’t invest unless you’re prepared to lose all the money you invest. This is a high-risk investment and you are unlikely to be protected if something goes wrong. Take 2 minutes to learn more

Bitcoin Price Prediction: March 19
The Bitcoin market has recently exhibited a somewhat subdued outlook, especially after falling below the $80K threshold. However, the price has since recovered above this level and is currently hovering around key technical landmarks.
BTC/USDT Long-Term Trend: Bearish (Daily Chart)
Key Price Levels:
Resistance: $85,000, $90,000, $100,000
Support: $80,000, $75,000, $70,000
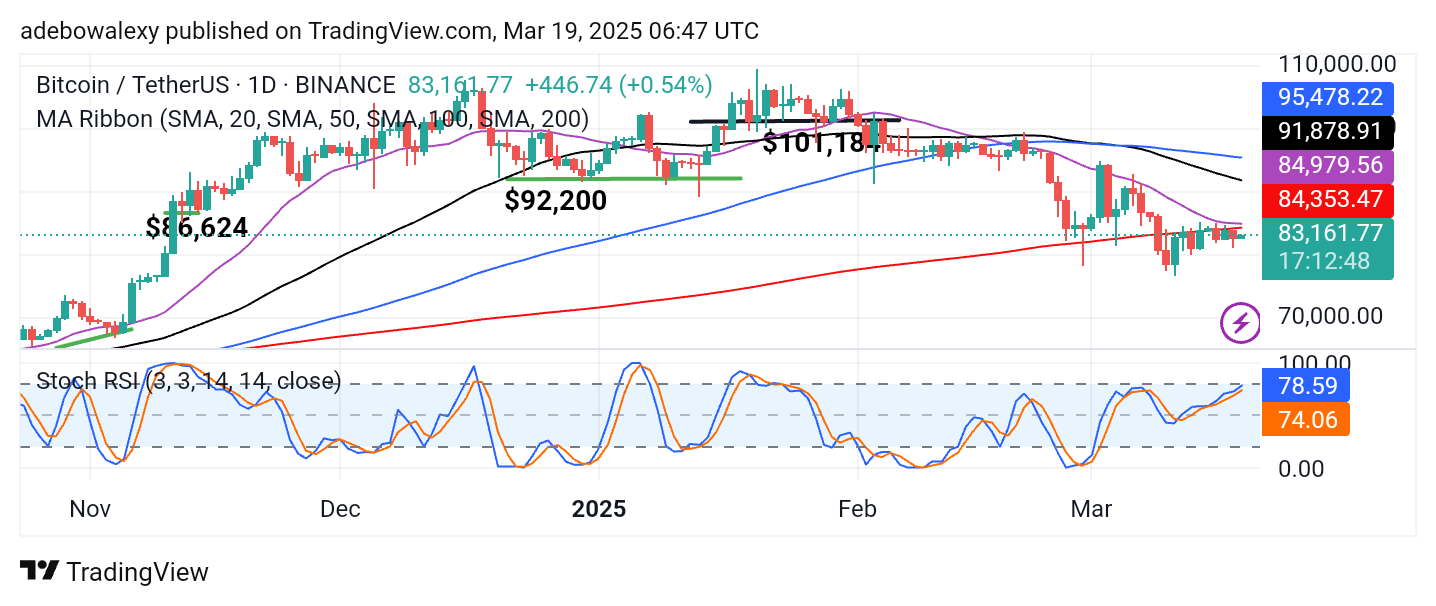
Bitcoin’s price activity in the daily market remains below all the Moving Average (MA) lines on the chart. Additionally, although price candles form below these MA lines, their bullish nature suggests a potential shift. Meanwhile, the Stochastic Relative Strength Index (RSI) is rising steadily into the oversold region. The RSI lines are now above the 75 mark, while price activity remains below the MA curves.
Bitcoin Price Prediction: BTC/USDT Keeps Clinching Minimal Gains
Bitcoin’s price activity in the daily market continues to lack a major catalyst. As a result, price action remains below the 200-day MA line. The ongoing session has been bearish, presenting only minimal gains.
Meanwhile, the Stochastic RSI lines have risen more noticeably than the actual price movement. However, given the behavior of technical indicators, the market may move upward in the coming sessions.
Bitcoin Price Prediction: BTC/USDT Bullish Momentum Dwindles (4-Hour Chart)
Although upside momentum remains visible in the recently formed price candles, Bitcoin’s price has risen past the 50-day MA line, with the ongoing session now testing the 20-day MA line as resistance. The latest price candle appears smaller than the previous one.
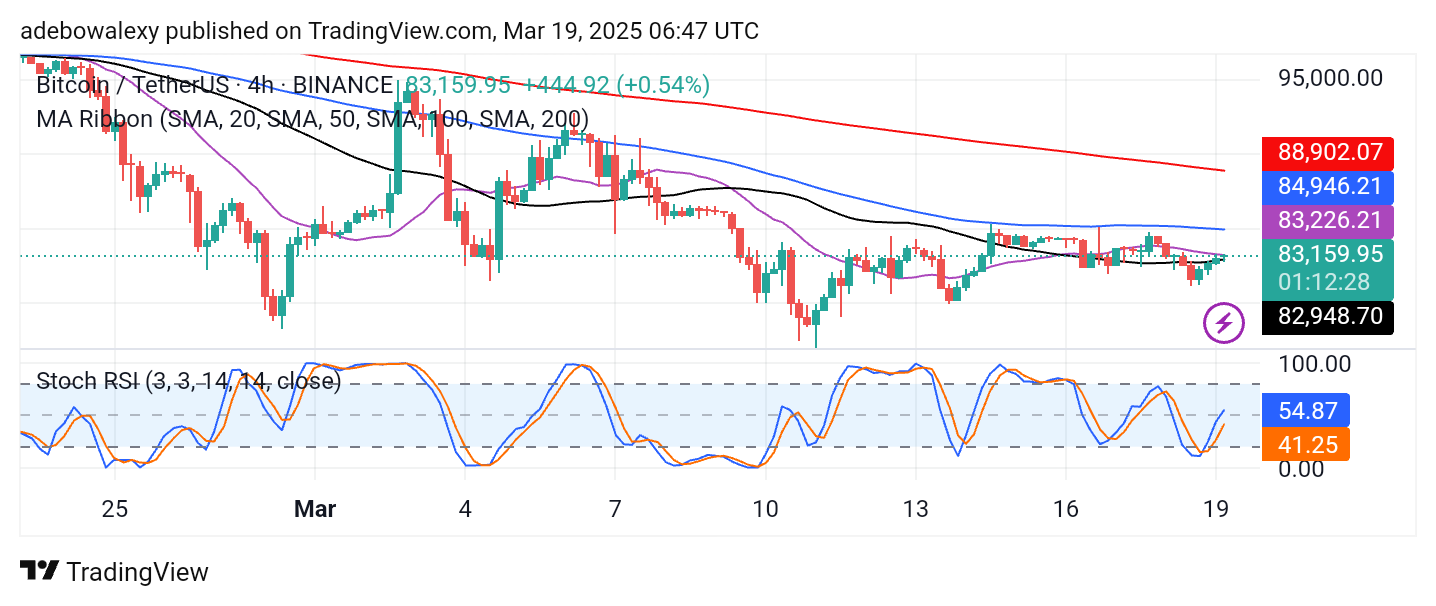
However, the Stochastic RSI lines are still trending upward, indicating that bullish forces are present. Upon closer observation, the lead RSI lines show signs of deflection, suggesting weakening bullish momentum. Traders should anticipate a potential pullback as short-term gains target the $85,000 price.