Wall Street Memes (WSM) Price Stabilizes, Reinforcing Momentum
Estimated Reading Time: 3 minutes
Don’t invest unless you’re prepared to lose all the money you invest. This is a high-risk investment and you are unlikely to be protected if something goes wrong. Take 2 minutes to learn more
Wall Street Memes Price Prediction – March 26
In line with the principles of affirming the trade myths of position accumulation, the WSM trade long-term buyers are expected to continue with their method of committing funds into the operations of the base instrument against the market valuation of the American currency as the crypto-economic price stabilizes basis, reinforcing momentum.
Traders should closely monitor the threshold of the lower Bollinger Band indicator when considering fresh buying orders, particularly in alignment with the directional cues from the oscillators. However, current market conditions suggest that additional patience is necessary to establish stable northward momentum.
WSM/USD Market
Key Levels
Resistance levels: $0.002, $0.0025, $0.003
Support levels: $0.0008, $0.0006, $0.0004
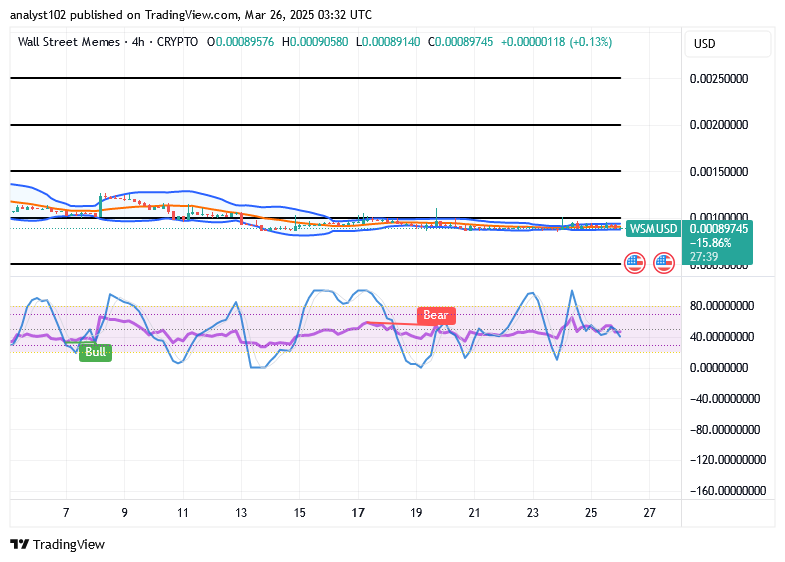
WSM/USD – 4-hour Chart
The medium-term chart of the WSM/USD trade mirrors that the crypto-economic price stabilizes at its baseline, reinforcing momentum in inputs.
Several signal formations have emerged beneath most candlesticks on the buy side of the lower Bollinger Band indicator, gradually mitigating potential declines. As of this analysis, the stochastic oscillators are attempting to establish a systematic re-basement pattern, tentatively dipping downward away from the 40-point mark.
With positioning orders of the indicators at this time, should the WSM/USD market purchasers be cautious of securing more values?
Optimistically, the behavioral situation as seen in the business activities of the WSM/USD trade is still a potency of allowing buyers to take advantage of the crypto instrument at its lowest opportunity price, given that the market now stabilizes its basement, reinforcing momentum.
As there has been a style of prolonging the market’s movements in ranges around the eastward-stretching pattern of the Bollinger Bands indicators, long-term position movers shouldn’t be scared of adding more points to the size of their portfolios, considering the confluence of support zones, price consolidation dynamics, liquidity influx, market depth, volatility contraction, and the potential for a breakout rally in alignment with trend continuation principles.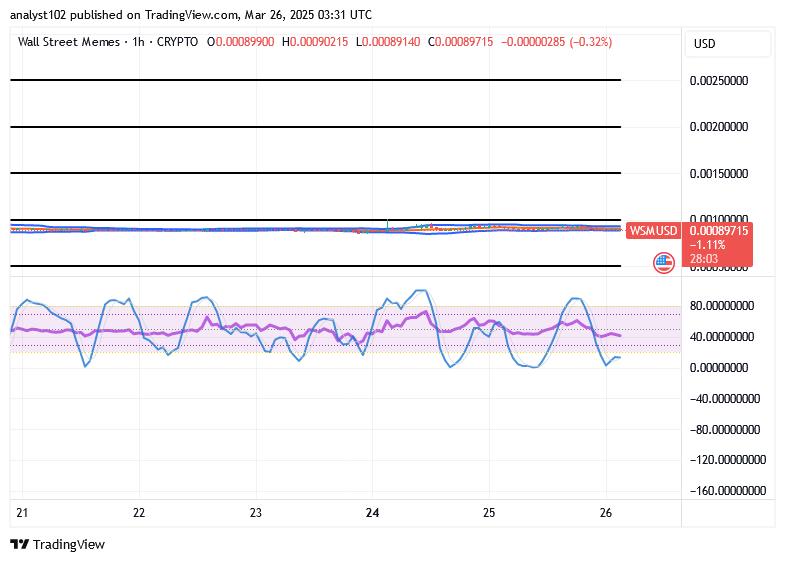
WSM/USD 1-hour chart
The 1-hour chart of the WSM/USD market now shows that the short-term running mode of the crypto-economic stabilizes its baseline, reinforcing momentum.
The Bollinger Bands’ trend lines remain extended eastward, signaling market indecision. Meanwhile, the stochastic oscillators have dipped into the oversold region, suggesting an impending resurgence of buying pressure.
BIGTIMEUSDT & WSMUSDT Contracts are now live on Bybit!
🚀 BIGTIMEUSDT & WSMUSDT Contracts now on Bybit!
— Bybit (@Bybit_Official) October 12, 2023
Dive into new trading opportunities with 1-25x leverage. Plus, they’re now on Bybit Futures Grid Bot! Start trading now.
📈 BIGTIME: https://t.co/FAQlbhnzAh
📈 WSM: https://t.co/pb2y2AfMBE#CryptoTrading #Bybit