Wall Street Memes (WSM) Trade Gallops, Stimulating Bounces
Estimated Reading Time: 3 minutes
Don’t invest unless you’re prepared to lose all the money you invest. This is a high-risk investment and you are unlikely to be protected if something goes wrong. Take 2 minutes to learn more

Wall Street Memes Price Prediction – March 25
The pace at which the potentiality of seeing the Wall Street Memes coin buyers going to push through variant overhead barriers is just being in the womb of time, as the crypto coin gallops in ranges, stimulating bounces in its pricing composure settings.
The attempted efforts that have been surfacing to drive the market further downward have steadily been practically observed to allow the WSM/USD trade bulls to pick out more reliable longing position orders at a point in time. In the light of that sentiment, just as it has been established in most recent past times, bears needed to be careful of going alongside most situations tending to produce a sudden pull down that can lead to getting them trapped in the process.
WSM/USD Market
Key Levels
Resistance levels: $0.002, $0.0025, $0.003
Support levels: $0.0008, $0.0006, $0.0004
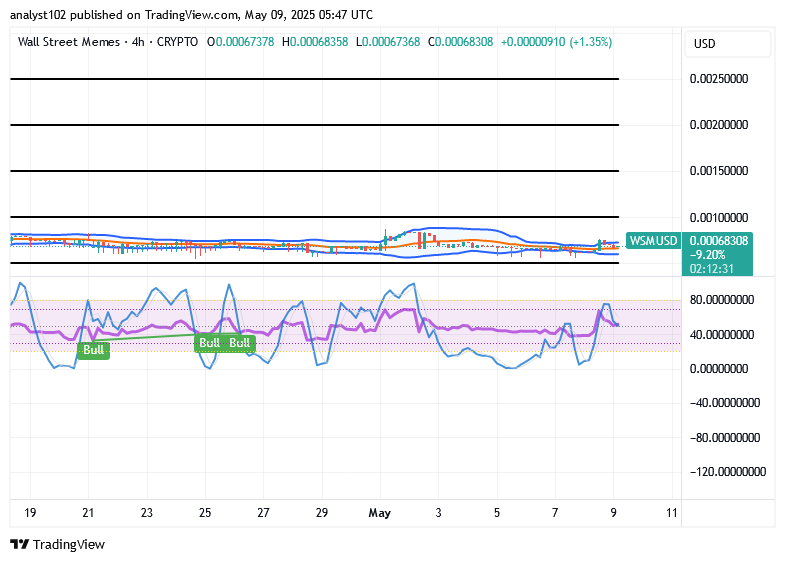
WSM/USD – 4-hour Chart
The medium-term chart of the WSM/USD trade showcases that the crypto-economic market presently gallops in a sideways manner, stimulating bounces.
A formation of various lighter, smaller candlesticks—primarily exhibiting a positive outlook—has emerged just below the $0.001 mark. The Bollinger Bands’ trend lines have consistently aligned with them in an eastward trajectory. Meanwhile, the stochastic oscillators are stabilizing near the 40 level, signaling a potential upward curve in the near term.
Is there a technical probability of WSM/USD market bears strengthening their position around the $0.001 value zone in the forthcoming sessions?
As there have been steady ups and downs in smaller quantities around the trade line of $0.001 overly, no indication has formed to back the possibility of seeing sellers dominating the market to the extent of achieving a huge result afterward, as the WSM/USD market now gallops in flat shapes, stimulating bounces in their signal notes.
Pushing the base crypto for more lows might be forthcoming systemically in lower lows, forming a structured accumulation phase that would simultaneously create decent longing entries for both existing and fresh intending capitalists to profit from the long-projected massive rebounds in the long run.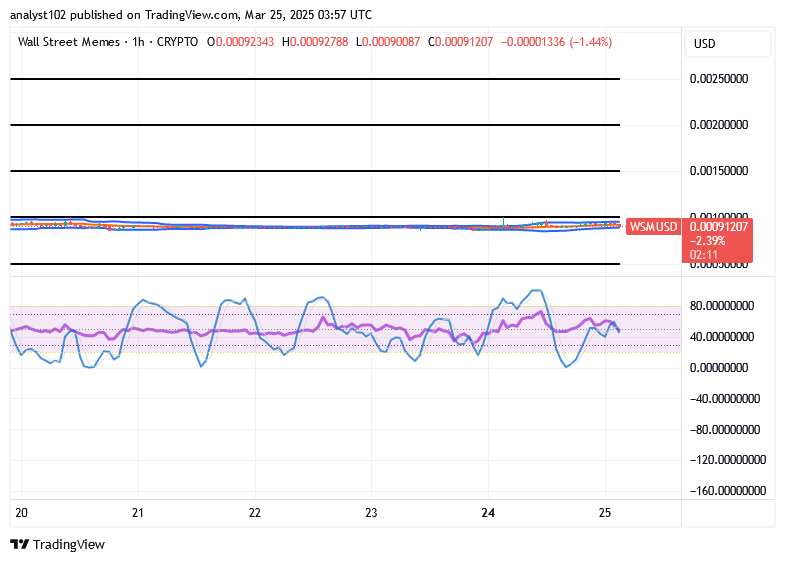
WSM/USD 1-hour chart
The 1-hour chart of the WSM/USD market is depicting that the short-term running mode of the crypto-economic price currently gallops in an eastward shape, stimulating bounces in its indexes.
The stochastic oscillators continue oscillating between positive and negative territories, affirming the market’s range-bound status. Meanwhile, the Bollinger Bands’ trend lines are shaping an emerging upward channel, signaling a potential price trajectory toward the $0.001 mark.
Only 3 days left until the massive $1M buyback is finalized!
3 DAYS TO GO UNTIL A MASSIVE $1M OF BUYBACKS IS COMPLETED! 🔥 $WSM 🚀
— Wall Street Memes (@wallstmemes) October 8, 2023
Buy Now ➡️ https://t.co/ffr2clEknx pic.twitter.com/bs8uNKIp8D