BANDUSD Continues to Accumulate at a Significant Level
Estimated Reading Time: 3 minutes
Don’t invest unless you’re prepared to lose all the money you invest. This is a high-risk investment and you are unlikely to be protected if something goes wrong. Take 2 minutes to learn more
BANDUSD Analysis – Price Continues to Accumulate at a Significant Price Level
BANDUSD continues to accumulate at a significant price level. The price is reacting at the $8.000 significant key level. The bulls and the bears are still in a tight spot as neither is in control of the market. This, however, caused the market to keep accumulating at this level. Before this accumulation, there was a shift from an uptrend movement. The direction of this change after a reversal above the $10.000 significant level.
BANDUSD Significant Levels:
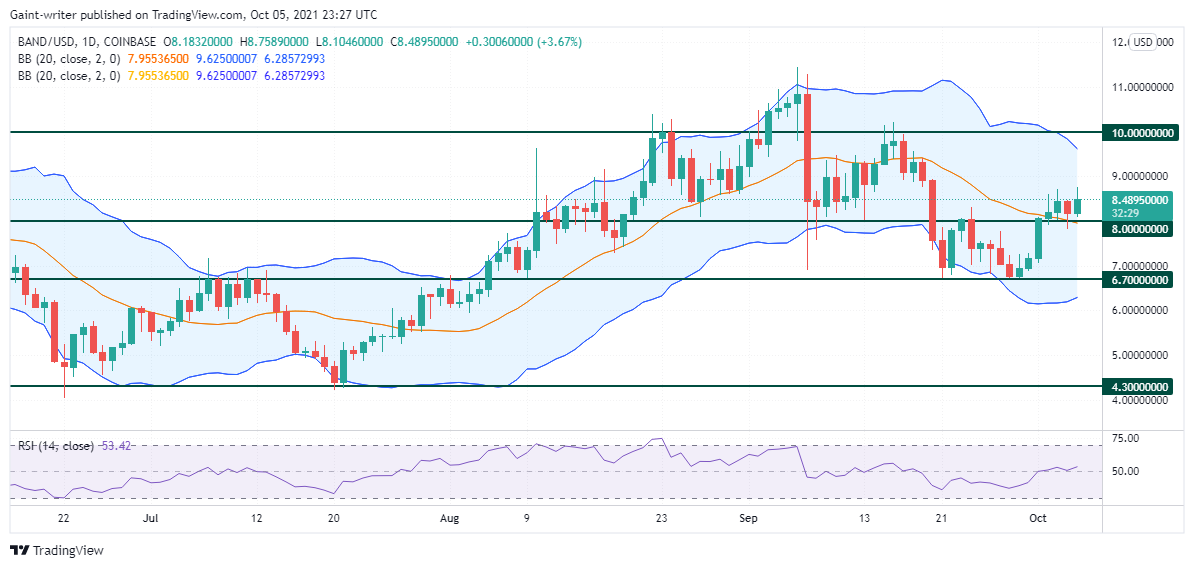
Resistance Levels: $10.000, $8.000
Support Levels: $6.700, $4.300
Before the uptrend movement, the market began to consolidate between the significant price level of $6.700 and $4.300. The market formed a W wave pattern before the price finally breaks out of the $6.700 significant price level. Before the bullish continuation, there was a retest at this level and the price then rallied upward, gaining bullish momentum. Band Protocol, however, rallied up beyond the $10.000 significant price level before a change in trend direction.
BANDUSD then begins its bearish movement with strong liquidity, as the price rallied down back to a $6.700 significant level. The market begins to trend downward, making lower lows and highs. The price is seen reacting at the $8.000 key level before its bearish trend continues. On the 1 day chart, the RSI (Relative Strength Index) indicator depicts a price signal around the 53.00 level. This still indicates indecision in the market, as it continues to accumulate.

Market Expectations
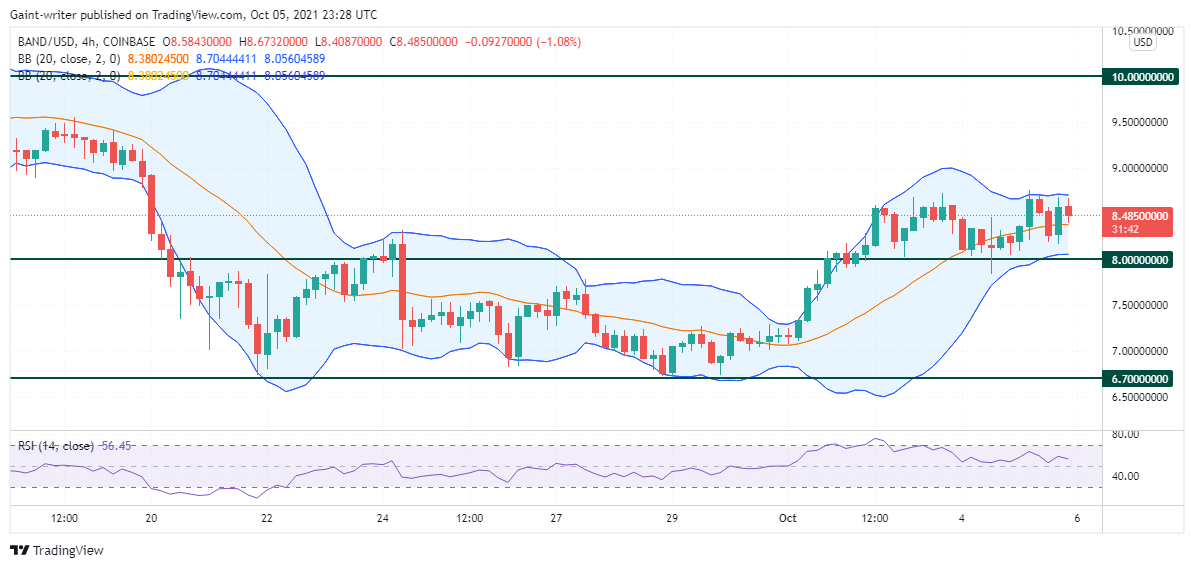
On the 4hour chart, the price has been consolidating before the reactions around the $8.000 significant level. As the market began to consolidate, the buyers and sellers remained quiet, and now both are struggling for market position. The Bollinger Band indicator is showing a squeeze as the price continues to accumulate around the $8.000 significant price level. It may break out either way if one finally gains control. The RSI is also ranging around the middle line due to the indecision of the market. The price will continue to accumulate before any breakout can occur.
You can purchase crypto coins here: Buy Tokens
Note: Cryptosignals.org is not a financial advisor. Do your research before investing your funds in any financial asset or presented product or event. We are not responsible for your investing results.