Bitcoin Cash (BCH/USD) Breaks Out of Sideways Range, Eyes $400
Estimated Reading Time: 3 minutes
Don’t invest unless you’re prepared to lose all the money you invest. This is a high-risk investment and you are unlikely to be protected if something goes wrong. Take 2 minutes to learn more
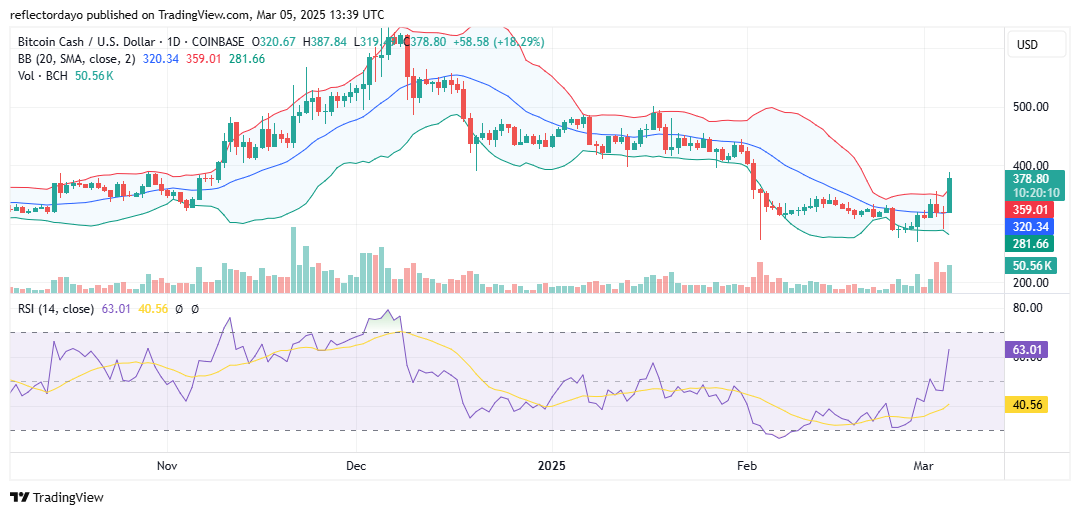
Since February 7, Bitcoin Cash (BCH) has been trading within a sideways range around the $318 price level, with buyers and sellers locked in a battle for control. This level has served as the market’s equilibrium, acting as a key area of contention between bulls and bears.
However, today’s market dynamics have shifted, with bullish momentum finally prevailing. Breaking above the $318 resistance has fueled stronger buying sentiment, propelling BCH into a significant uptrend.
As the price climbs, traders are increasingly focused on the $400 level, where a potential market correction could occur. With growing caution among investors as BCH approaches this threshold, a pullback may be expected before the next major price move.
Bitcoin Cash Market Data
- BCH/USD Price Now: $380
- BCH/USD Market Cap: $7.5 billion
- BCH/USD Circulating Supply: 19.8 BCH
- BCH/USD Total Supply: 19.8 million BCH
- BCH/USD CoinMarketCap Ranking: #20
Key Levels
- Resistance: $400, $450, and $500
- Support: $318, $300, and $270.
The Bitcoin Cash Market Through the Lens of Indicators: Surges as Bulls Dominate, Eyes on Potential Correction
Today’s trading session is marked by a strong bullish candlestick, signaling that buying pressure has dominated the Bitcoin Cash market. This surge follows nearly a month-long battle at the $318 price level, where bulls ultimately gained the upper hand, shifting market sentiment in their favor.
The breakout above $318 has attracted increased bullish momentum, driving the price to higher levels. However, as BCH approaches the $400 mark, signs of bearish resistance are emerging. The upper shadows on the daily candlestick suggest that selling pressure is beginning to build, potentially leading to a price correction.
While strong bullish moves are often followed by retracements, they also help establish higher support levels, reinforcing the market’s upward trajectory. If a pullback occurs, bulls will likely attempt to secure a stronger foundation for the next phase of the recovery.
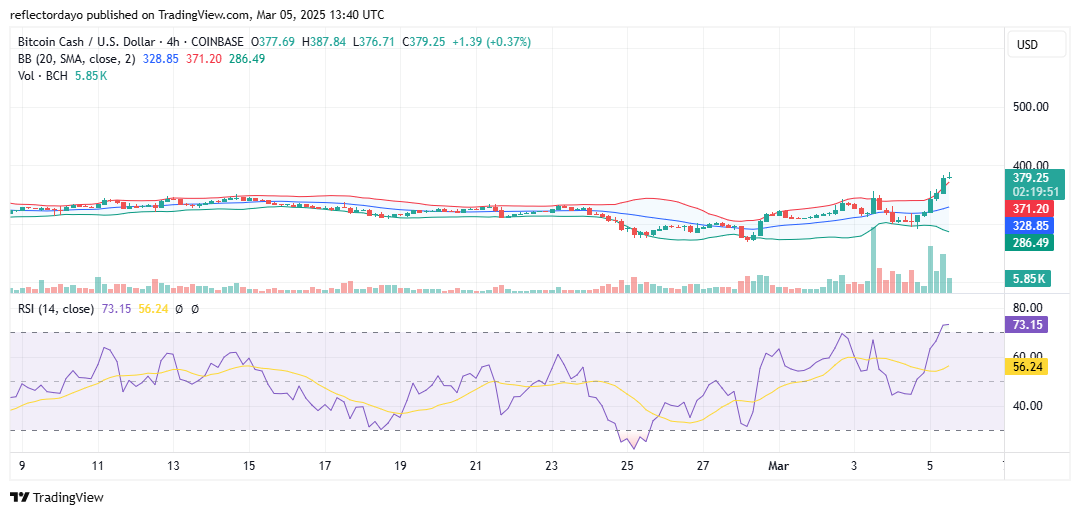
BCH/USD Price Prediction: 4-Hour Chart Analysis
A gravestone doji has emerged on the 4-hour chart, signaling a potential reversal following today’s strong bullish surge. This candlestick pattern suggests that buying momentum may be weakening, paving the way for a possible market correction.
Despite this, bulls are still pushing forward, as evidenced by the fact that the current peak surpasses the previous high from the last 4-hour session. However, market conditions indicate that a pullback is increasingly likely. The Relative Strength Index (RSI) is overbought, and the Bollinger Bands show the price nearing the upper boundary—both signals that suggest an impending correction in the crypto signal.
If bulls manage to sustain their momentum, the market may enter a consolidation phase around $380 before determining its next move. Traders should monitor this level closely, as it could dictate whether BCH continues its upward trajectory or undergoes a temporary pullback.