Litecoin (LTC) Price Prediction: LTC/USDT Bears Are Positioned for Future Price Declines
Estimated Reading Time: 3 minutes
Don’t invest unless you’re prepared to lose all the money you invest. This is a high-risk investment and you are unlikely to be protected if something goes wrong. Take 2 minutes to learn more

Litecoin Price Prediction: March 18
The Litecoin market has dipped below the $90 price mark. Yet, indications support the opinion that the market may still descend further to lower support levels. This is quite possible, considering that bears are still in control, as evidenced by the price action.
LTC/USDT Long-Term Trend: Bearish (Daily Chart)
Key Price Levels:
Resistance: $90.00, $95.00, $100.00
Support: $85.00, $80.00, $75.00
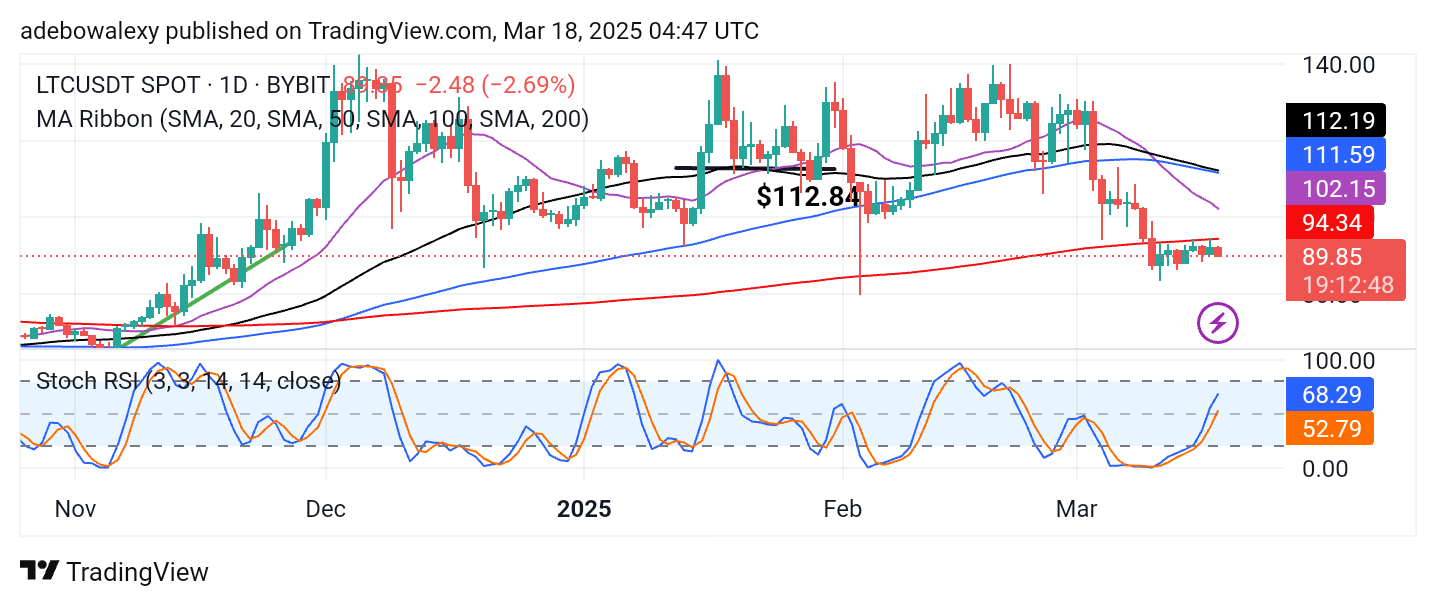
Price activity in the LTC/USDT daily chart continues to show that headwinds are prevailing. The latest price candle on the daily chart appears red. While it is of moderate size, it has placed the token’s price below all the represented Moving Average (MA) lines on the chart. Simultaneously, the Stochastic Relative Strength Index (RSI) lines can still be seen rising into the overbought zone.
Litecoin Price Prediction: LTC/USDT Presents a Bearish Market
The Litecoin market has been descending from one technical support level to another. The market recently reached the $90 support level and eventually broke through it. The appearance of price action in the ongoing session suggests that this market may decline further.
The latest price candle on the chart has appeared below all the MA lines, and its corresponding price candle is red, indicating that downward forces are dominating. Meanwhile, the Stochastic RSI lines are rising into the overbought region. Considering the divergence of technical indicators, it does not seem likely that this market will proceed significantly upward.
Litecoin Price Prediction: LTC/USDT Maintains Bearish Focus (4-Hour Chart)
In the Litecoin 4-hour chart, a new session has begun, and downward forces are still leading. This is evident from the fact that the corresponding price candle is red. Additionally, the price candle consistently appears below all the MA lines on the chart. As a result, the Stochastic RSI lines are descending into the oversold region.
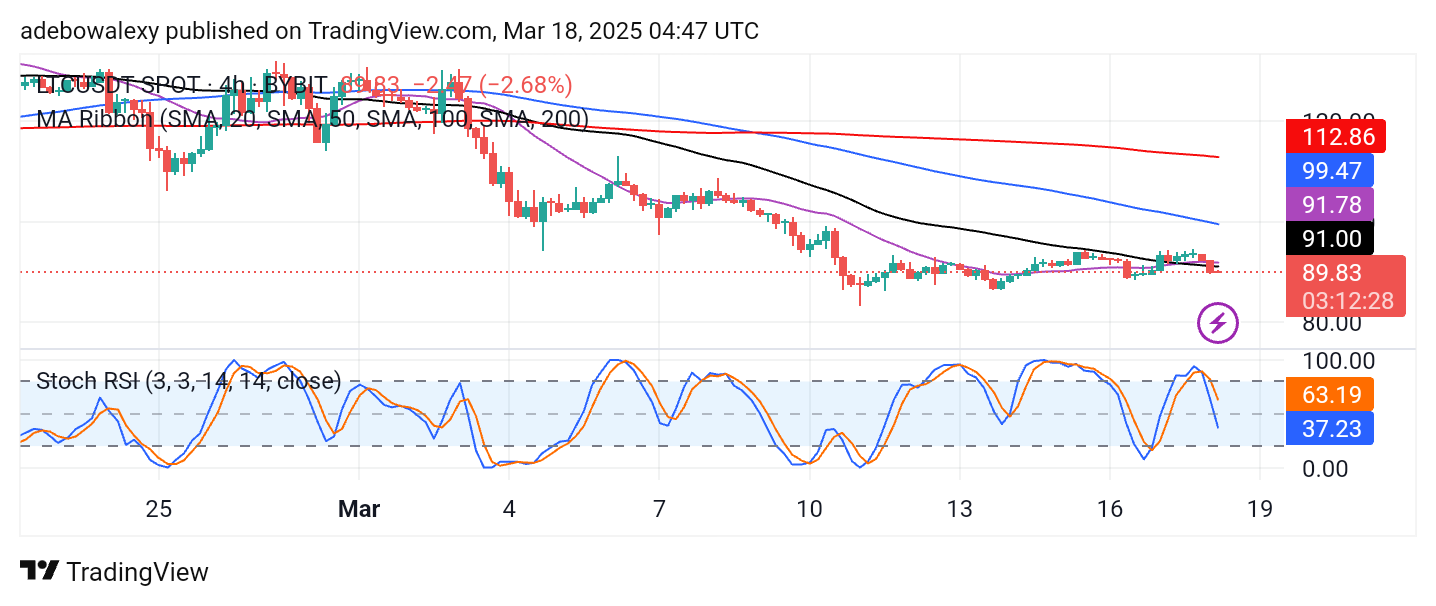
Here, the Stochastic RSI lines are moving into the oversold region, aligning with the price movement trajectory. However, one must note that the movement of the Stochastic RSI seems too fast compared to the actual price movement. Therefore, bears should aim at nearby support levels, such as the $85 price mark.