Ethereum Stalls above $2,430 as It Reaches Overbought Conditions
Estimated Reading Time: 2 minutes
Don’t invest unless you’re prepared to lose all the money you invest. This is a high-risk investment and you are unlikely to be protected if something goes wrong. Take 2 minutes to learn more

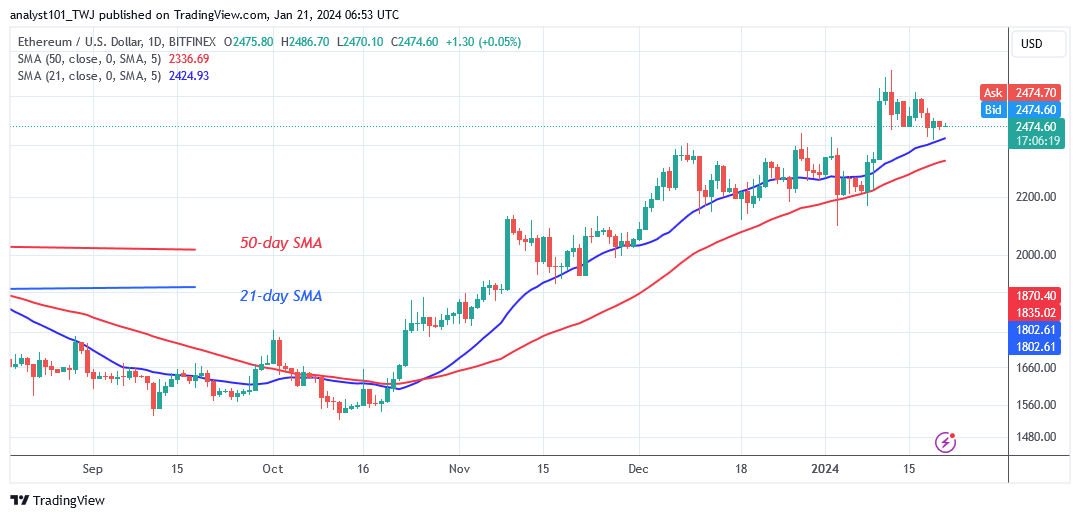
Ethereum Price Long-Term Analysis: Bullish
Ethereum’s (ETH) remains above the moving average lines as it reaches overbought conditions. On January 18, the altcoin fell above $2,428 and then consolidated above it. Price movement has stalled due to the development of Doji candlesticks above the current support level. Ether is now trading at $2,477 at the time of writing.
If the price rises above the present support level, Ether’s upward momentum will resume. Bullish momentum will take prices back to earlier highs of $2,600 and $2,700. ETH/USD will surge to the psychological price level of $3,000 if buyers overcome the resistance levels. In the meantime, Ethereum remains above the moving average lines.
Technical indicators:
Major Resistance Levels – $2, 600, $2,800, $3,000
Major Support Levels – $1.600, $1, 400, $1,200
Ethereum Indicator Analysis
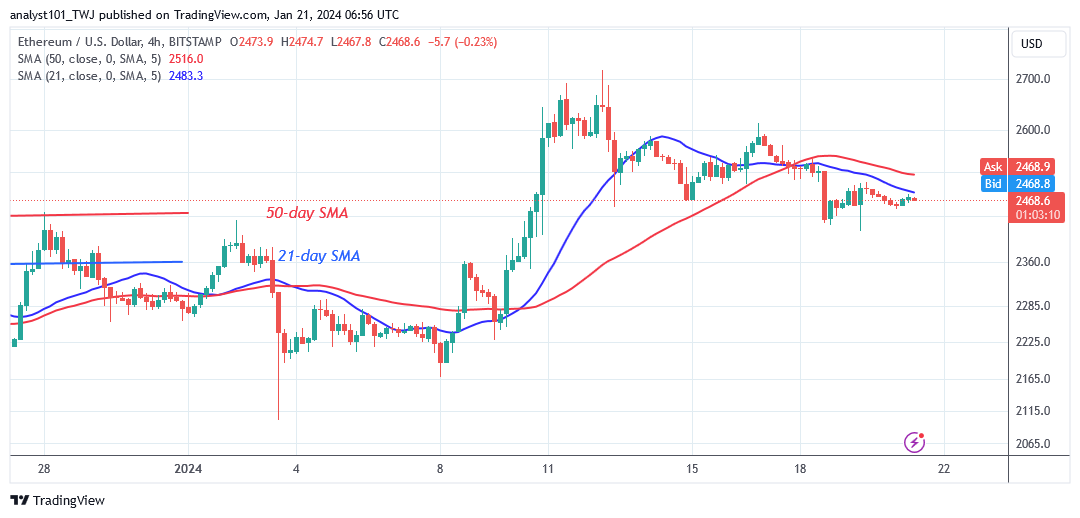
Ether price bars are trading above the upward-sloping moving average lines. Ether’s price will grow as long as it continues above the moving average lines. However, the current fall has caused the increasing trend to come to an end. On the 4-hour chart, Ether’s price action is marked by Doji candlesticks.
Conclusion
Ethereum is stuck in a range on the 4-hour chart as it reaches overbought conditions. Ether is trading in a limited range of $2,430 to $2,510. The price movement has been constrained by the Doji candlesticks. The moving average lines act to limit the upward trend.
You can buy crypto coins here. Buy LBLOCK
Note: Cryptosignals.org is not a financial advisor. Do your research before investing your funds in any financial asset or presented product or event. We are not responsible for your investing results


