Polkadot Circles above the $5.00 Support for a Potential Upward Surge
Estimated Reading Time: 3 minutes
Don’t invest unless you’re prepared to lose all the money you invest. This is a high-risk investment and you are unlikely to be protected if something goes wrong. Take 2 minutes to learn more
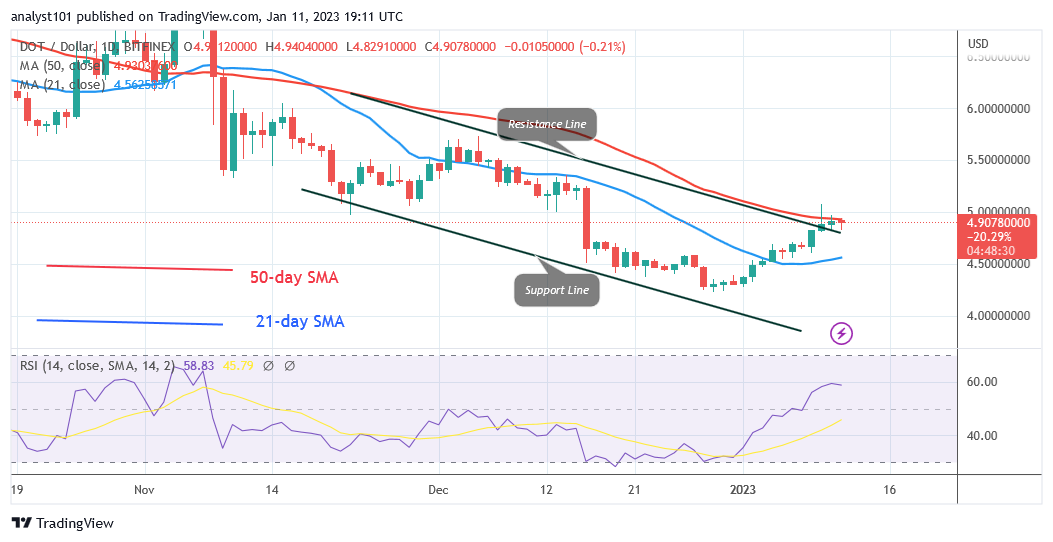
Polkadot (DOT) Long-Term Analysis: Bearish
Polkadot (DOT) price surpassed the $5.00 mark as it prepares for a potential upward surge. If the bullish momentum continues, the digital asset can go to a high of $5.52. The bullish momentum will then continue to the $7.50 high. On the plus side, if buyers manage to keep the price above the 50-day SMA, the cryptocurrency will move faster.
Polkadot is likely to retest its previous high of $7.50 as long as buyers retain the price above the 50-day SMA and the $5.00 barrier. The altcoin has now gotten to the point where the market is overbought. At the most recent high, the bullish momentum can be rejected. After being rejected at the latest high, the DOT price is now retreating. If the cryptocurrency drops and finds support above the 21-day SMA, it will be driven into a range-bound trend. If the bears’ breach below the 21-day line SMA, the downtrend will resume.
Polkadot (DOT) Indicator Analysis
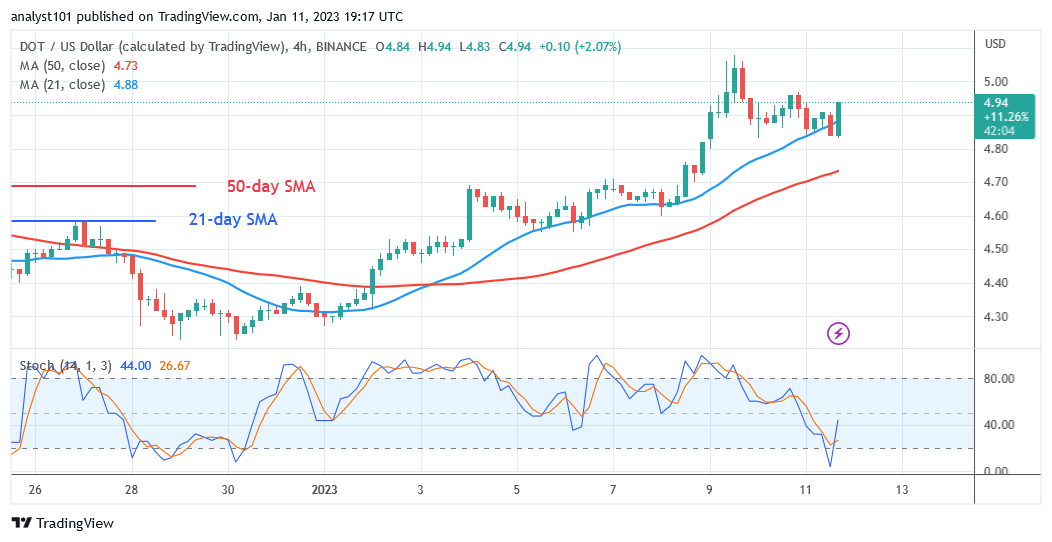
The cryptocurrency is currently at a Relative Strength Index level of 62. It is reaching overbought territory, which will force the altcoin to fall. If the price bars hold above the moving average lines, the DOT price will rise further. Polkadot has hit the overbought region of the daily Stochastic above level 80. The current upsurge is nearing the end of its bullish run.
Technical indicators:
Major Resistance Levels – $10, $12, $14
Major Support Levels – $8, $6, $4
What Is the Next Direction for Polkadot (DOT)?
DOT/USD breaks through the $5.00 resistance level and the 50-day SMA as it prepares for a potential upward surge. It is circling above the $5.00 support in preparation for a potential upward surge. On the other side, Polkadot will fall and start moving in a range again if buyers are unable to sustain the price above the resistance or the 50-day line SMA.
You can purchase crypto coins here. Buy LBLOCK
Note: Cryptosignals.org is not a 1a financial advisor. Do your research before investing your funds in any financial asset or presented product or event. We are not responsible for your investing results