Polkadot Enters Overbought Region as It Drops Below $5.00
Estimated Reading Time: 2 minutes
Don’t invest unless you’re prepared to lose all the money you invest. This is a high-risk investment and you are unlikely to be protected if something goes wrong. Take 2 minutes to learn more
Polkadot (DOT) Long-Term Analysis: Bearish
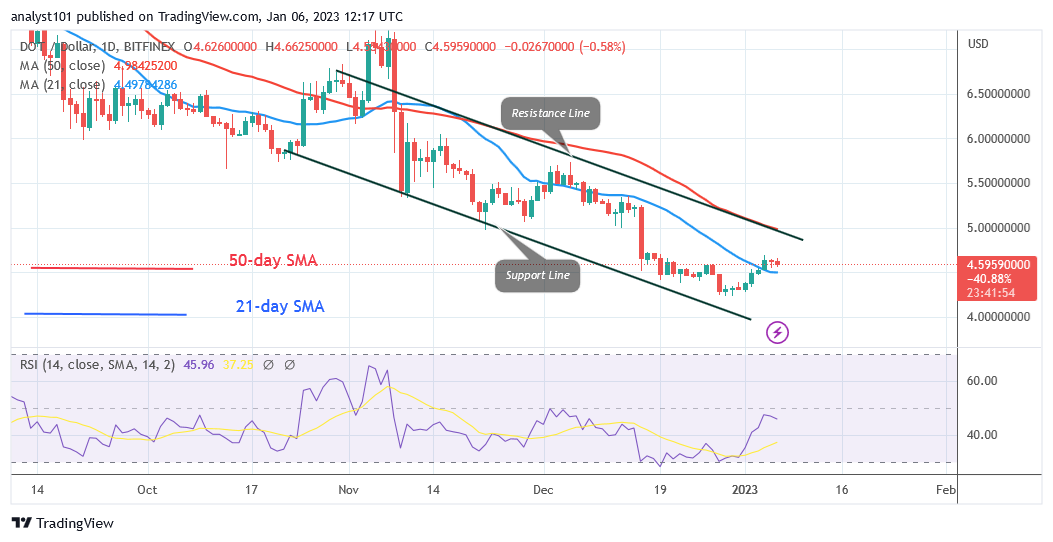
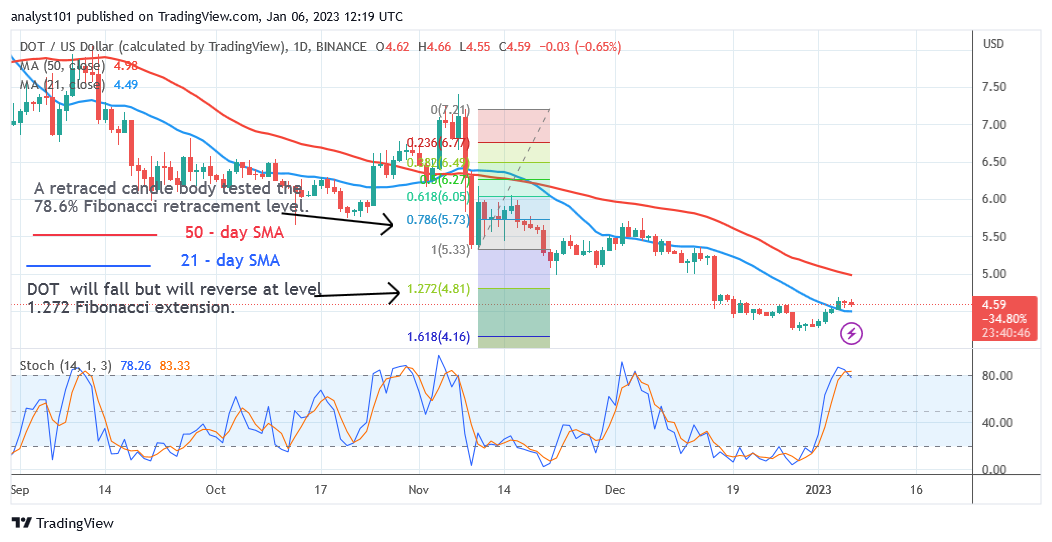
Polkadot (DOT) is currently making an upward correction but drops below $5.00. Although the 50-day line SMA has not been crossed, the price of the cryptocurrency has broken the 21-day line SMA. The altcoin will reach its previous high of $7.00 if it breaks above the 50-day SMA or the resistance at $5.00. However, the $5.00 resistance zone is currently rejecting the altcoin. On the downside, Polkadot will be forced into a range-bound move between the moving average lines if it declines and finds support above the 21-day SMA. If the bears break below the 21-day line SMA, the downtrend will resume. DOT/USD is going to drop to its previous low of $4.25.
Polkadot (DOT) Indicator Analysis
For period 14, the DOT price is at level 45 of the Relative Strength Index. As the altcoin corrected upward, the RSI increased. Due to the price bars’ proximity to the moving average lines, the altcoin might be forced to move in a range. The daily Stochastic of the cryptocurrency has overbought territory, which is above level 80. It suggests that in the overbought area, sellers will show up to lower prices. The 21-day and 50-day SMAs’ downward slopes serve as indicators of the downtrend.
Technical indicators:
Major Resistance Levels – $10, $12, $14
Major Support Levels – $8, $6, $4
What Is the Next Direction for Polkadot (DOT)?
Polkadot is trading in the overbought region as it drops below $5.00. As sellers appear in the overbought area, the altcoin is likely to decline. Currently, it is being rejected at the $5.00 resistance level. The cryptocurrency is likely to fall if it is rejected at its most recent high. It will rally above the 50-day SMA if it breaks through the initial resistance at $4.69.
You can purchase crypto coins here. Buy LBLOCK
Note: Cryptosignals.org is not a 1a financial advisor. Do your research before investing your funds in any financial asset or presented product or event. We are not responsible for your investing results