Dogecoin (DOGE) Price Prediction: DOGE/USDT Rally Cools Above the $0.1400 Price Level
Estimated Reading Time: 3 minutes
Don’t invest unless you’re prepared to lose all the money you invest. This is a high-risk investment and you are unlikely to be protected if something goes wrong. Take 2 minutes to learn more

Dogecoin (DOGE) Price Prediction: October 21
The price of Dogecoin surged past a two-month-old resistance level last week following Elon Musk’s tweet about “DOGE” (Department of Government Efficiency). However, the excitement seems to have cooled as the market hovers just above the $0.1400 threshold.
DOGE/USDT Long-term Trend: Bullish (Daily Chart)
Key Price Levels:
Resistance: $0.1500, $0.1600, $0.1700
Support: $0.1400, $0.1300, $0.1200
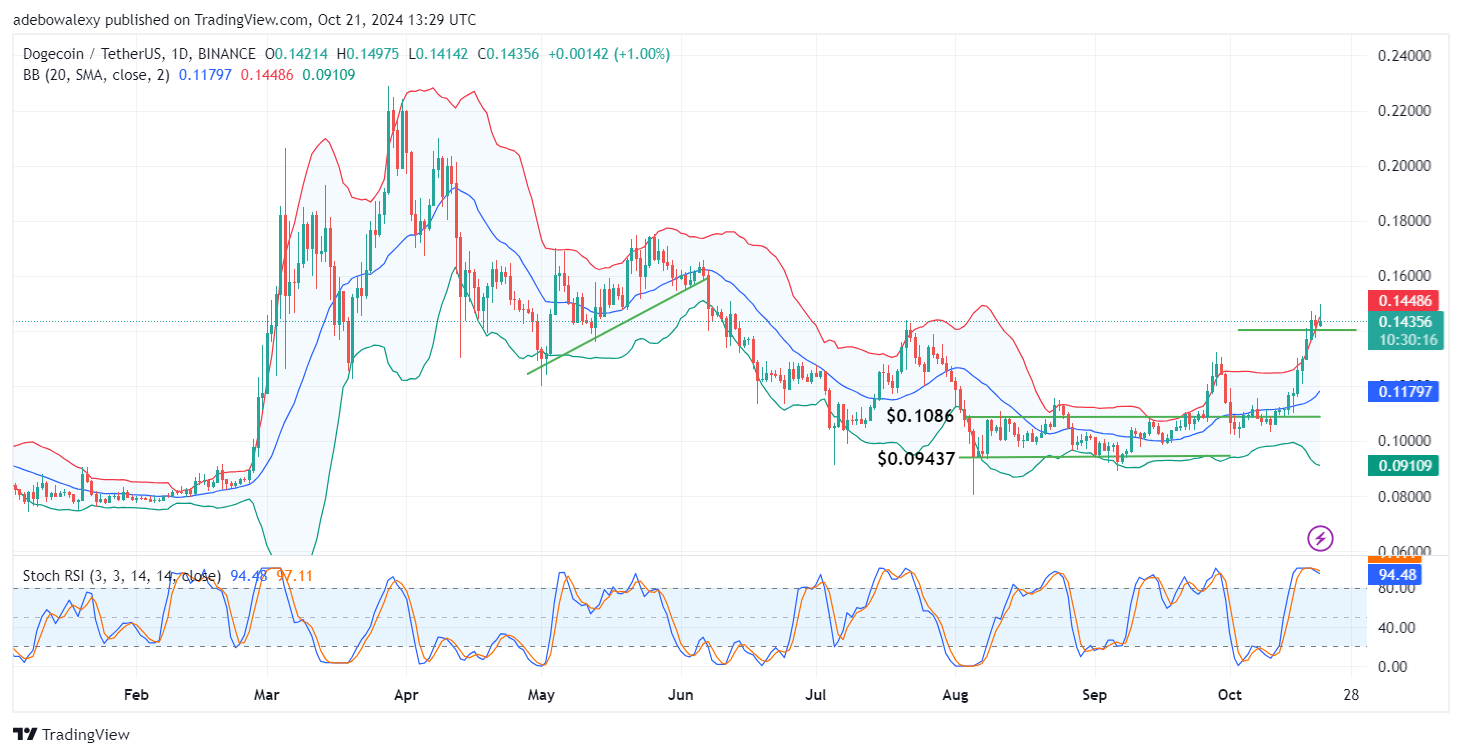
The latest price candle on the chart still hugs the upper limit of the Bollinger Bands and appears green. Meanwhile, the Stochastic Relative Strength Index (Stochastic RSI) lines have reached the overbought region but are now slightly oriented downward. However, the indicator lines remain well above the 80 mark of the Stochastic RSI.
Dogecoin (DOGE) Price Prediction: DOGE/USDT Stays Largely on a Bullish Path
Dogecoin experienced a significant price surge last week, pushing the coin above the $0.1400 threshold, a multi-month resistance level. Price action still suggests that further upward movement is possible. The corresponding price candle on the daily chart remains bullish and continues to hug the upper limits of the Bollinger Bands.
The Stochastic RSI lines also remain in the overbought region. Although the terminal part of these lines is slightly oriented downward, they are still significantly above the 80 level of the indicator. Coupled with the green appearance of the last candle, this suggests that the upward correction may continue.
Dogecoin (DOGE) Price Prediction: DOGE/USDT May Still Leap Upward (4-Hour Chart)
The Dogecoin 4-hour market shows a downward correction for two consecutive sessions. However, trading continues above the middle Bollinger Band. The Bollinger Bands indicator itself has a slight upward trajectory, though the upper and lower limits have contracted slightly. The Stochastic RSI indicator has delivered a crossover below the 50 and 40 marks, though the resulting lines are not moving with much momentum yet.
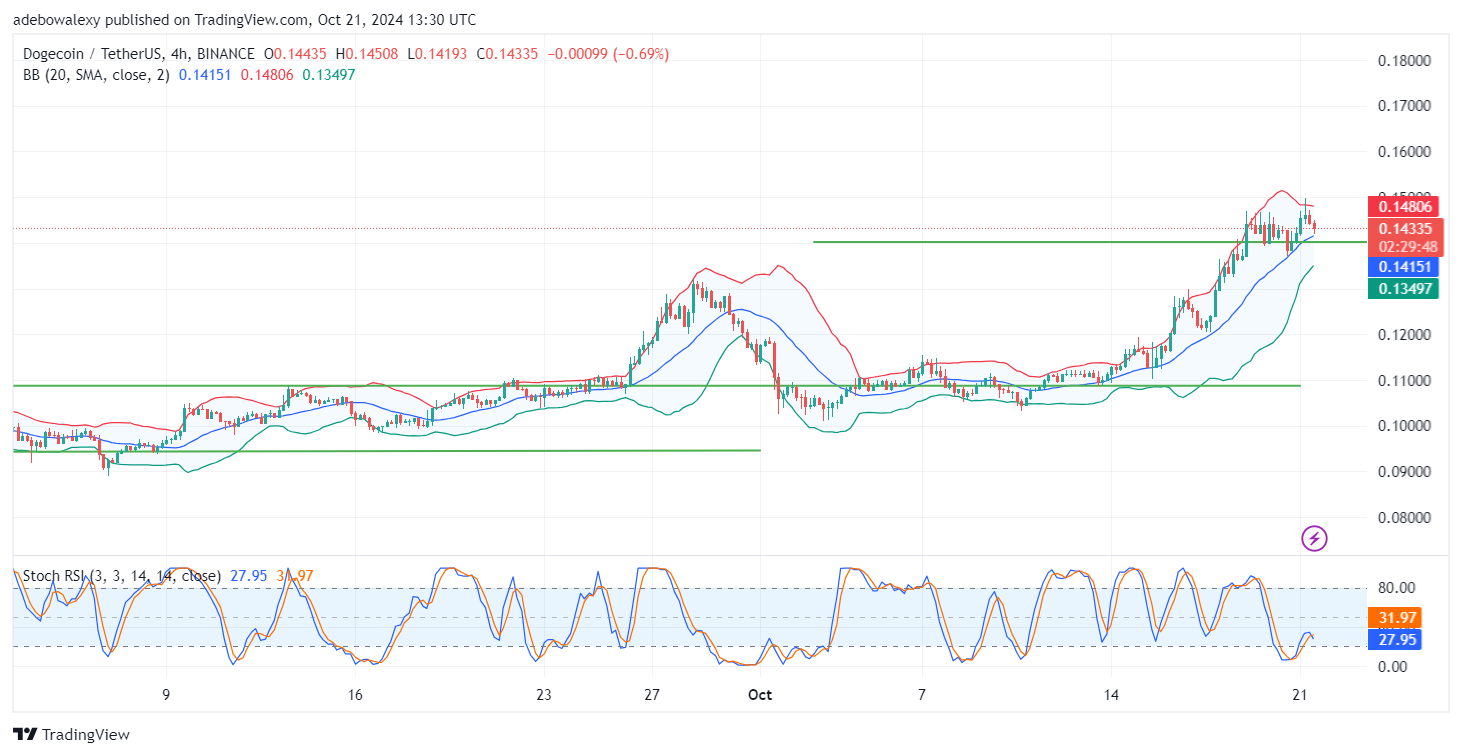
While the market appears bearish, the trend may persist. Price action remains above the middle Bollinger Band, suggesting that a rebound may occur off the middle band or the psychological support at the $0.1400 level, potentially pushing prices toward $0.1500 and beyond.