Polygon (ex-MATIC) Price Prediction: POL/USDT May See a Price Surge
Estimated Reading Time: 3 minutes
Don’t invest unless you’re prepared to lose all the money you invest. This is a high-risk investment and you are unlikely to be protected if something goes wrong. Take 2 minutes to learn more

Polygon (ex-MATIC) Price Prediction: October 19
Polygon (ex-MATIC) has maintained a depressed market in recent times, with its price falling below the $0.4000 threshold. However, signs of an impending bullish movement are beginning to appear. This may push the market through the immediate resistance up ahead and further beyond that.
POL/USDT Long-term Trend: Bullish (Daily Chart)
Key Price Levels:
Resistance: $0.4000, $0.4500, $0.5000
Support: $0.3500, $0.3000, $0.2500
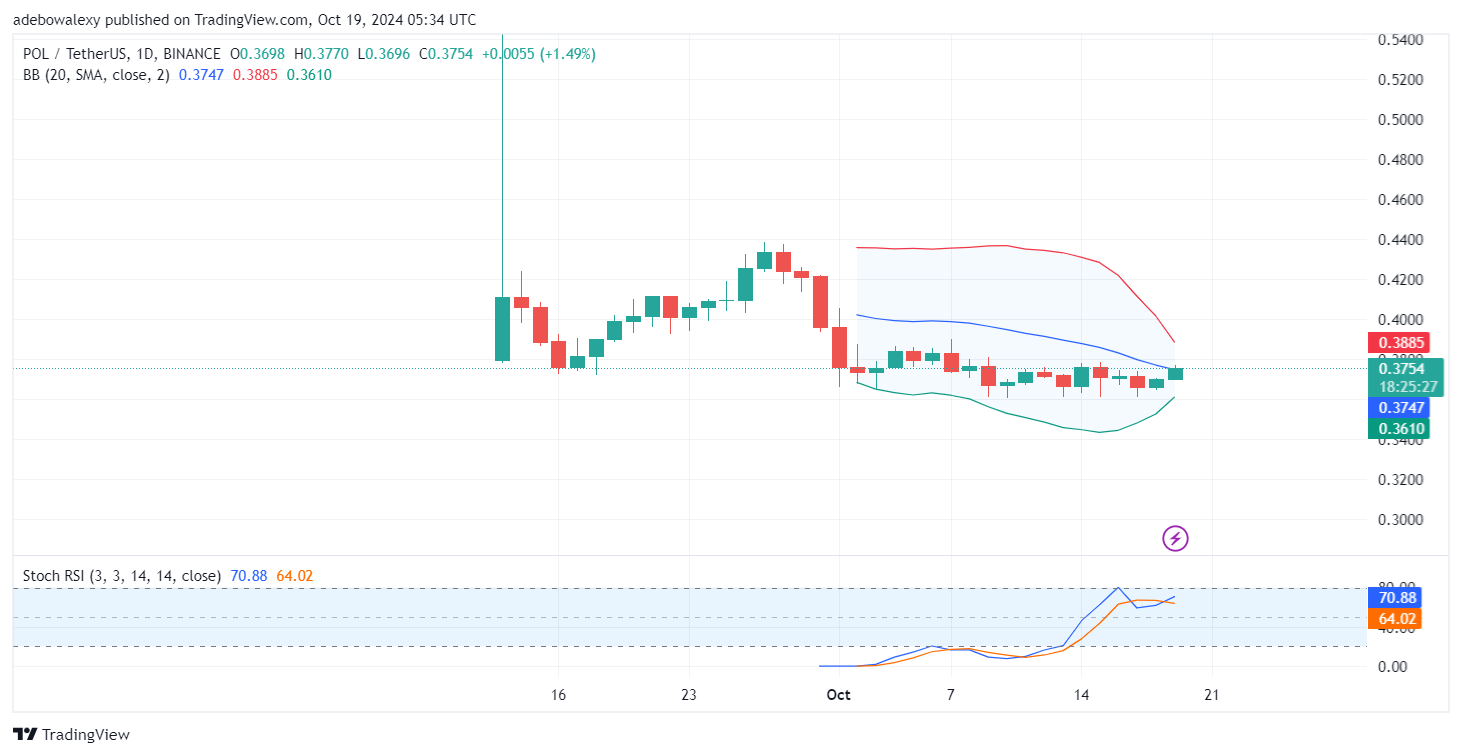
The ongoing session on the daily chart appears bullish. The current price candle can be seen placing Polygon’s (ex-MATIC) price just above the middle limit of the Bollinger Bands indicator. Meanwhile, the extreme bands of the same indicator are converging, indicating a potential contraction. Additionally, the Stochastic Relative Strength Index (Stochastic RSI) lines are steadily rising upward after an upside crossover.
Polygon (ex-MATIC) Price Prediction: POL/USDT Stays on a Bullish Path
With Polygon (ex-MATIC) price activity rising steadily past the middle limit of the Bollinger Bands indicator, this suggests that further positive movements may be forthcoming. The contraction of the upper and lower limits of the Bollinger Bands technically hints at an impending one-sided price move. Since price activity has already passed some bullish tests, it seems likely that the move will be a bullish one.
Similarly, the Stochastic RSI is steadily rising toward the overbought region of the indicator. The lines of this indicator are still below the 80 mark, but when combined with other indicators, it is likely that these lines will soon surpass the 80 level. This would boost bullish sentiment in the market.
Polygon (ex-MATIC) Price Prediction: Will POL/USDT Push Further? (4-Hour Chart)
In the POL/USDT 4-hour market, the price movement has been trending upward. One of the most significant price moves in this market came in the previous session, where the corresponding price candle pushed against the upper limit of the Bollinger Bands indicator. The ongoing session has appeared as a red-price candle, with its body positioned at the upper part. Additionally, the Stochastic RSI lines are still rising into the overbought region.
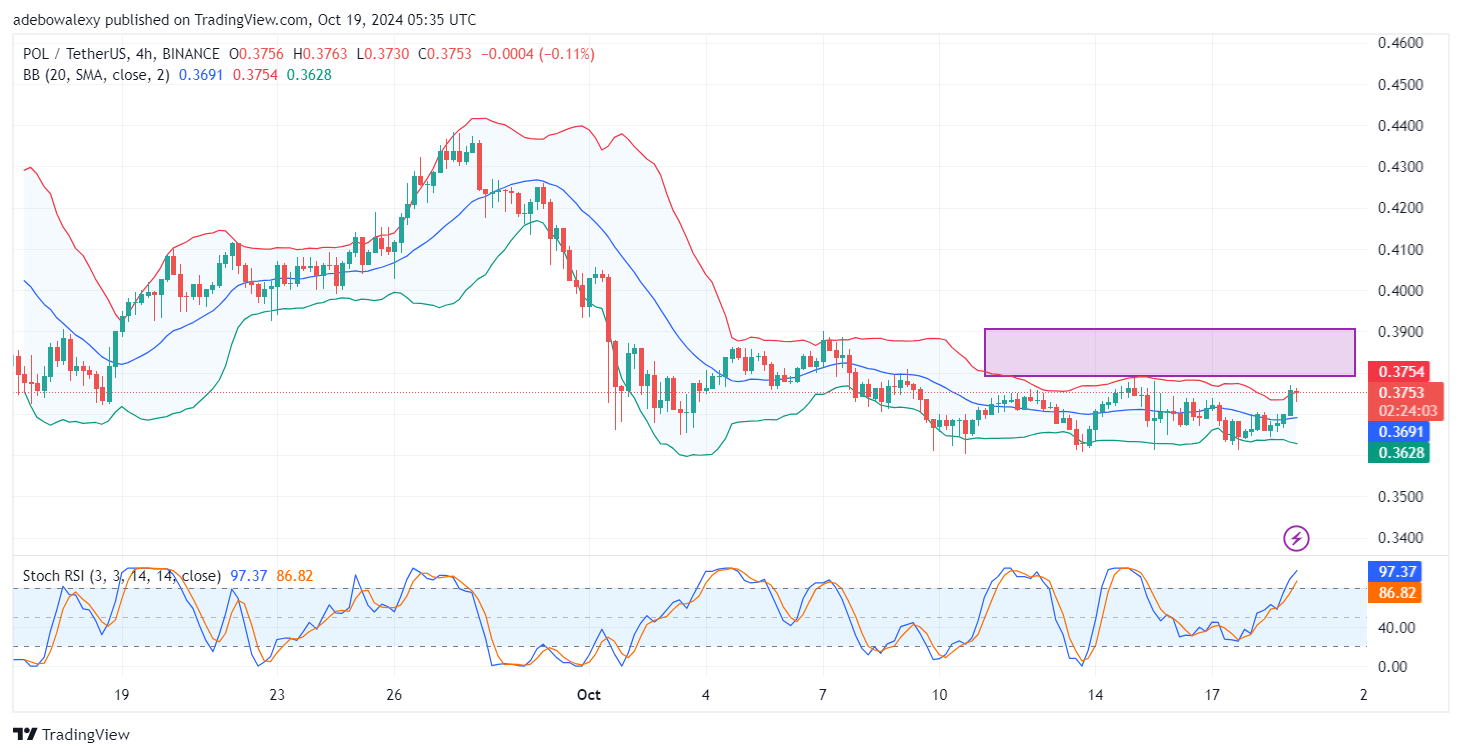
Technically, most of the indications here suggest that upside forces still have momentum. This could support continued upward retracement even through the upper Bollinger Bands. Therefore, traders can expect price action to rise past the $0.3800 mark.