Solana (SOL) Price Prediction: SOL/USDT Trades Above the $150.00 Mark
Estimated Reading Time: 3 minutes
Don’t invest unless you’re prepared to lose all the money you invest. This is a high-risk investment and you are unlikely to be protected if something goes wrong. Take 2 minutes to learn more

Solana (SOL) Price Prediction: October 18
The Solana market has eventually surpassed the $150.00 mark and, as of the time of writing, is trading at $152.64. Furthermore, its price action stands just above a baseline that suggests an upside rebound may occur, leading to further price increases in subsequent sessions.
SOL/USDT Long-term Trend: Bullish (Daily Chart)
Key Price Levels:
Resistance: $155.00, $160.00, $165.00
Support: $150.00, $145.00, $140.00
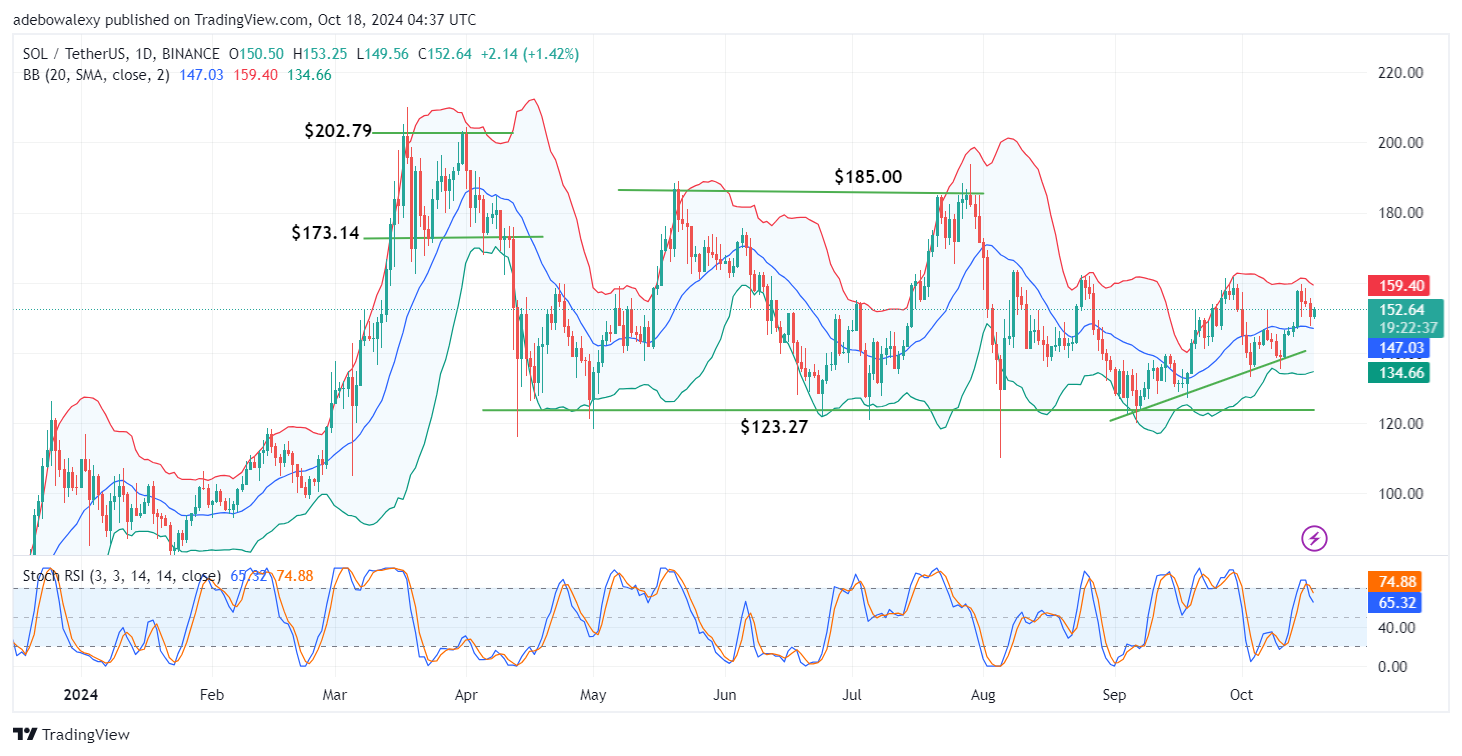
The corresponding price candle in the ongoing session can be seen appearing green above the middle Bollinger Bands. This price candle has formed after the previous session tested the middle band of the Bollinger Bands indicator as a support level. However, the Stochastic Relative Strength Index (Stochastic RSI) indicator line is generally descending toward the 60 mark, with only a slight deflection on the leading line of the indicator.
Solana (SOL) Price Prediction: Will SOL/USDT Bullish Rebound Extend Towards Higher Marks?
The middle line of the Bollinger Bands appears to have provided a strong and elastic base for Solana’s price action. This impression stems from the fact that price action rebounded off that limit in the previous session when it tested it as a support level. The current session appears bullish, hinting that buying activity has resumed. However, the lines of the Stochastic RSI are still generally descending.
At this point, technical indicators seem somewhat divergent. However, one thing is certain: the market has seen an upside rebound in this session and above a promising threshold. Be that as it may, more careful observation may be needed.
Solana (SOL) Price Prediction: SOL/USDT May Retrace Higher Price Level (4-Hour Chart)
In the Solana 4-hour market, price movement has rebounded from the lower limit of the Bollinger Bands. This occurred in the past two sessions and has extended to the current one. Price action is now steadily approaching the middle line of the Bollinger Bands. Additionally, the Stochastic RSI lines are rising upwards from the oversold region steeper.
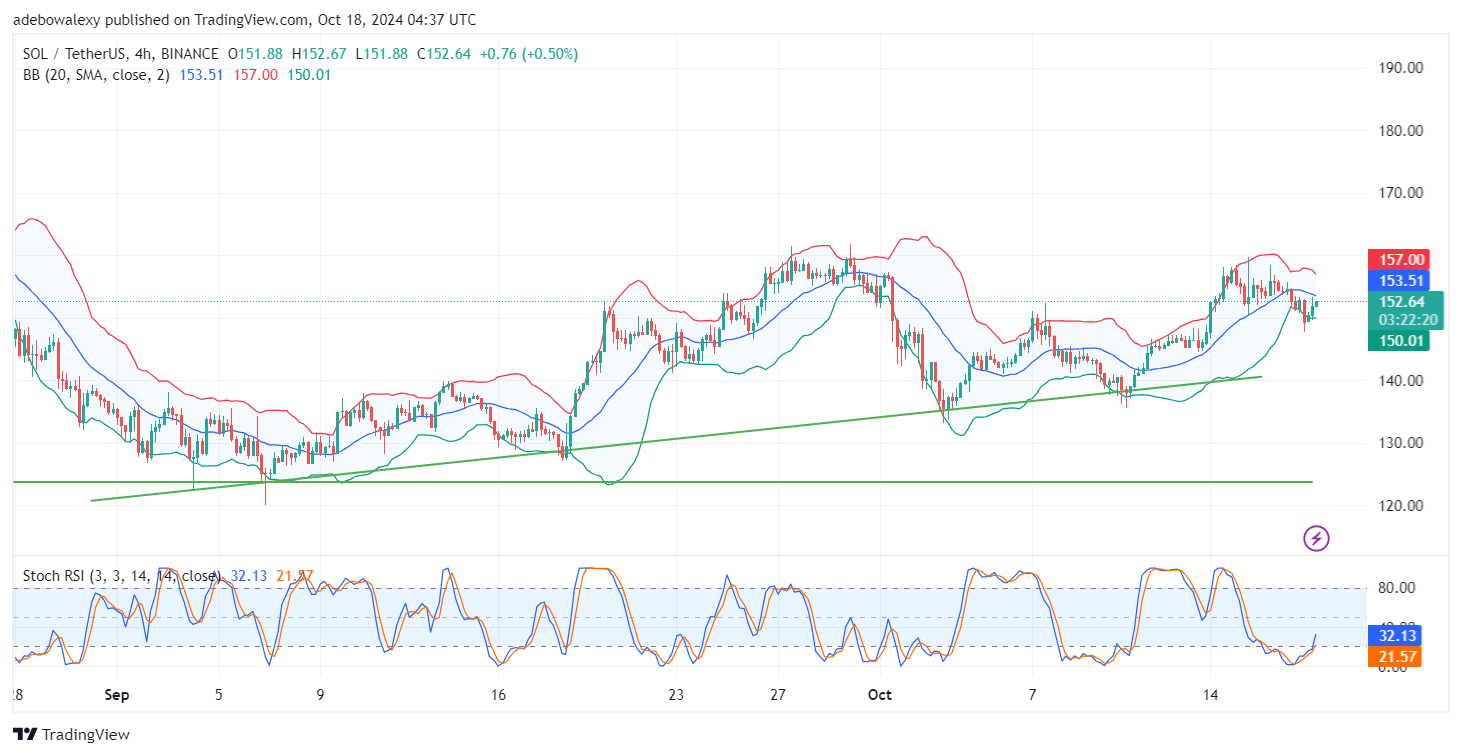
Price movement shows that upward forces are active in this market, keeping it upward. Meanwhile, the Stochastic RSI indicator is providing impetus, indicating that bullish momentum is in good shape. Therefore, trades can still target the $155.00 mark, while the market may trend toward $160.00 subsequently.