The Neo Market (NEO/USD) Shows Strength: Market Rebounds
Estimated Reading Time: 3 minutes
Don’t invest unless you’re prepared to lose all the money you invest. This is a high-risk investment and you are unlikely to be protected if something goes wrong. Take 2 minutes to learn more

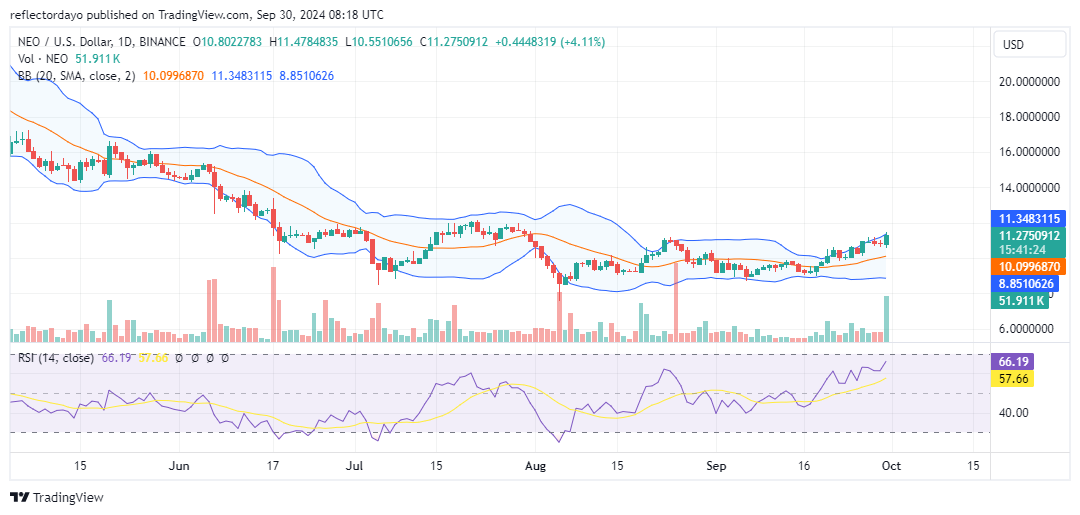
After reaching a yearly high of approximately $24.00 in April, the Neo market experienced a prolonged downward trend characterized by lower highs and lower lows. This bearish sentiment persisted until August when the market found support near the $8.50 price level.
Subsequently, a notable increase in bullish sentiment stabilized the market, resulting in a period of consolidation. However, a recent price surge has broken through the nearest resistance level, which is at $11.00, indicating a potential uptrend towards the $12.00 mark.
The Neo Market Data
- NEO/USD Price Now: $11.3
- NEO/USD Market Cap: $ 793 million
- NEO/USD Circulating Supply: 70 million
- NEO/USD Total Supply: million 100 million
- NEO/USD CoinMarketCap Ranking: #87
Key Levels
- Resistance: $12.00, $13.00, and $14.00.
- Support: $8.50, $8.00, and $7.00.
Neo Market Analysis: The Indicators’ Point of View
The recent breakthrough of the $11.13 price level represents a significant milestone for the Neo market. This bullish momentum is likely to bolster investor confidence, potentially driving the market towards the next target, $12.00.
The Bollinger Bands indicator reflects this upward trend, with the upper band diverging upwards while the lower band remains relatively flat. This suggests that bullish forces are actively pushing the market out of its current horizontal trading range.
However, a closer analysis reveals that today’s bullish candlestick formation is not as strong as the current trading volume, indicating that some investors may still maintain a bearish outlook. Additionally, there’s a possibility that traders who entered long positions near the $8.50 support level, anticipating a quick reversal, might be taking profits as the market rises above the $11.00 resistance. This crypto signal could be one of the factors contributing to the market’s slower-than-expected upward movement.
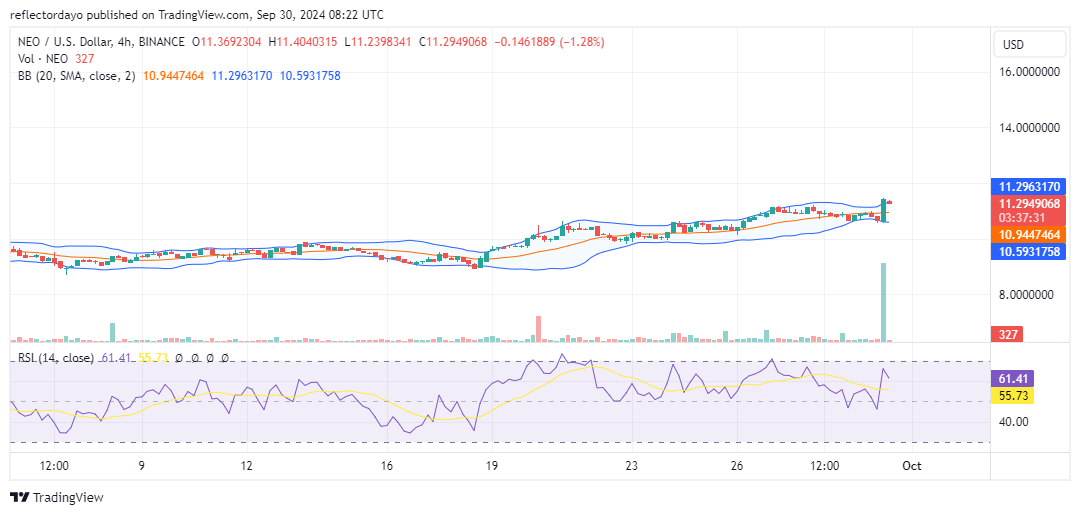
NEO/USD 4-Hour Chart Outlook
Zooming in on the 4-hour chart, it’s evident that bullish momentum may be starting to wane. Traders appear to be reaching a point of exhaustion. The combination of a significant bullish candlestick, albeit less prominent than the recent trading volume surge, suggests a growing balance between bullish and bearish forces.
If this equilibrium persists, the Neo market could be poised for a potential reversal before continuing its upward trajectory.