Starknet (STRK/USD) Breakout: A New Chapter Begins
Estimated Reading Time: 2 minutes
Don’t invest unless you’re prepared to lose all the money you invest. This is a high-risk investment and you are unlikely to be protected if something goes wrong. Take 2 minutes to learn more
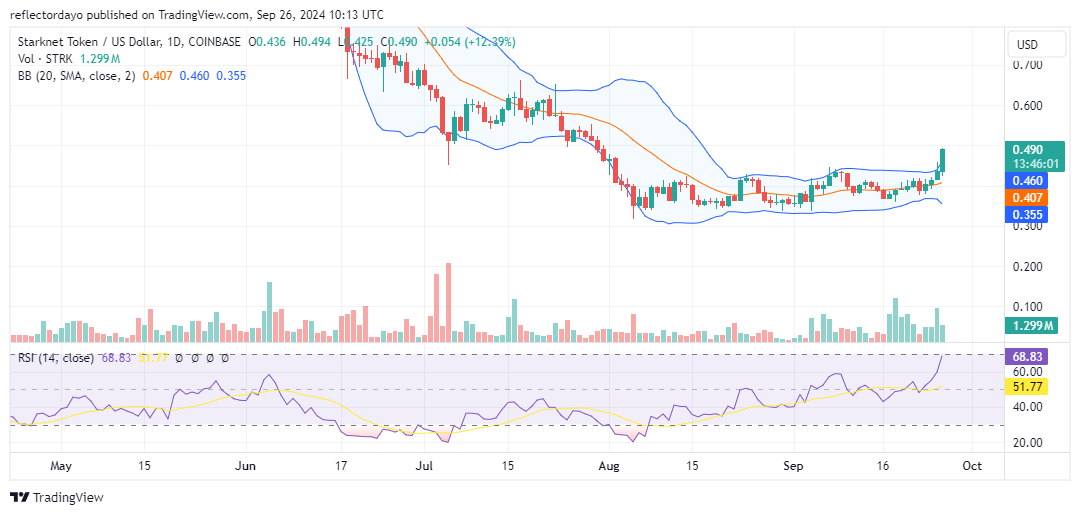
The resistance level at $0.4 has held firm since early August. However, in today’s trading session, the Starknet market unexpectedly broke above the $0.4 mark. This significant breakout has generated increased bullish sentiment, which may drive the crypto signal further and potentially push it beyond the $0.5 level. Given the current momentum and interest, the market shows potential for breaking above the $0.5 resistance level.
Starknet Market Data
- STRK/USD Price Now: $0.065
- STRK/USD Market Cap: 886 million
- STRK/USD Circulating Supply: 1.8 billion
- STRK/USD Total Supply: 10 billion
- STRK/USD CoinMarketCap Ranking: #79
Key Levels
- Resistance: $0.50, $0.55, and $0.60
- Support: $0.350, $0.30, and $0.25.
The Starknet Market Through the Lens of Indicators
The volume of trade indicator for Starknet (STRK/USD) has been exhibiting substantial investor interest since early September. This surge in trading activity has culminated in a breakout, with the market continuing to show bullish momentum.
Analyzing the Relative Strength Index (RSI), the line is approaching the overbought threshold of 70. While this crypto signal may suggest a potential decrease in bullish bias, the overall market sentiment remains positive. However, if some traders begin to take profits at the $0.5 price level, support levels around $0.45 and $0.40 could act as a bounce pad. If the market successfully holds above these levels, it could continue its upward trend and potentially break through the $0.5 resistance.
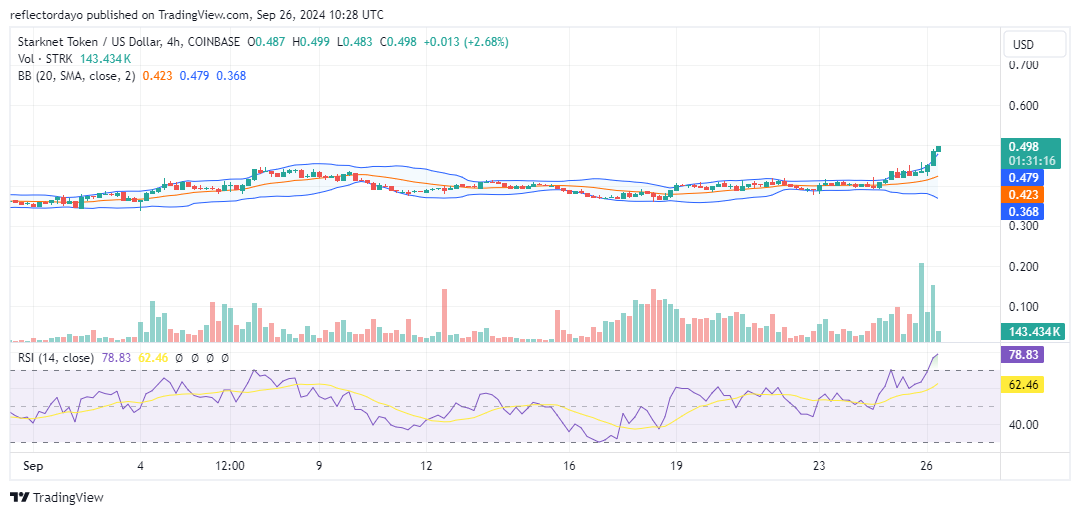
STRK/USD Price Prediction: 4-Hour Chart Analysis
While the 4-hour chart indicates a strong bullish momentum in Starknet (STRK/USD), the Bollinger Bands suggest increasing market volatility. As the price approaches the $0.5 price threshold, the widening bandwidth of the Bollinger Bands indicates a heightened potential for a bearish correction.
Additionally, the Relative Strength Index (RSI) is currently in the overbought territory. This suggests that a correction may be imminent, especially as the market nears the $0.5 price level.