Lucky Block (LBLOCK) Shows Promising Signs of Recovery Amid Tight Trading Range
Estimated Reading Time: 3 minutes
Don’t invest unless you’re prepared to lose all the money you invest. This is a high-risk investment and you are unlikely to be protected if something goes wrong. Take 2 minutes to learn more

Lucky Block (LBLOCK) has experienced a steady trading range, currently priced at $0.00001897 with a modest increase of 1.17%. Despite some minor fluctuations, the market sentiment around LBLOCK remains positive, as technical indicators suggest potential upward movement in the near future.
Daily Chart Analysis of Lucky Block
On the daily chart, LBLOCK is seen trading within a relatively tight range, with the Bollinger Bands displaying a slight contraction. This narrowing of the bands indicates that a breakout could be imminent. Currently, LBLOCK is trading just below the middle Bollinger Band, with support levels identified at $0.00001674 and resistance at $0.00002002.
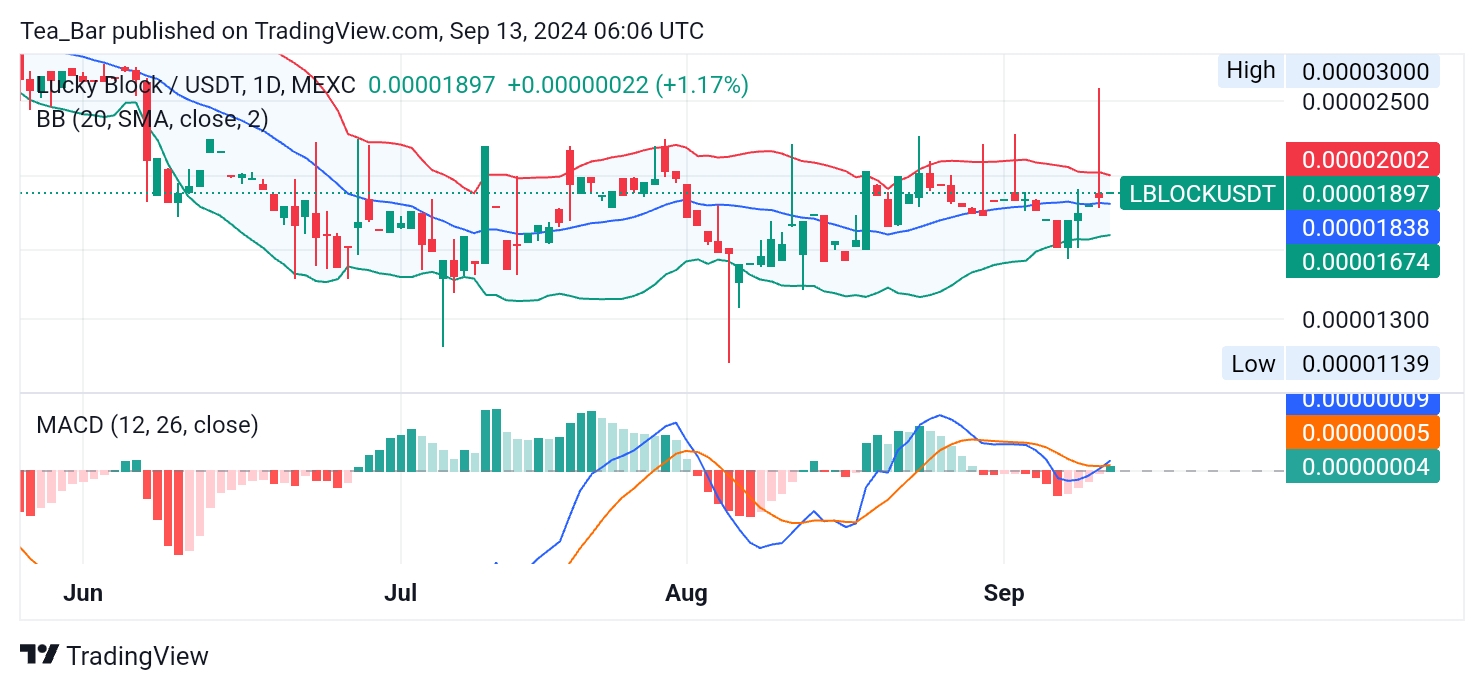
The Moving Average Convergence Divergence (MACD) on the daily chart shows a decreasing bearish momentum, with the histogram bars gradually shifting from red to green. This transition suggests that the coin is building up for a potential retest of the resistance levels around $0.00002002, signaling a possible bullish trend.
4-Hour Chart Analysis
The 4-hour chart paints a similar picture of consolidation. LBLOCK is trading at $0.00001897, with immediate support visible at $0.00001779 and resistance at $0.00002036. The Bollinger Bands are even tighter on this shorter time frame, indicating that a more significant price movement could occur soon.

In the MACD indicator, the shorter time frame displays weakening bearish momentum, with a potential crossover between the MACD line and the signal line. This suggests that LBLOCK could see a bullish shift in the upcoming sessions, with the possibility of breaking through the immediate resistance of $0.00002036.
Conclusion
Lucky Block (LBLOCK) is currently trading within a tight range, but technical indicators point toward a possible breakout. Traders should keep an eye on key resistance levels at $0.00002002 on the daily chart and $0.00002036 on the 4-hour chart. A breakout beyond these levels could spark a bullish run, making LBLOCK a coin to monitor closely in the coming days.
You can purchase Lucky Block here. Buy LBLOCK.