The Orca Market (ORCA/USD) Breaks Through Key $3.00 Resistance Level
Estimated Reading Time: 3 minutes
Don’t invest unless you’re prepared to lose all the money you invest. This is a high-risk investment and you are unlikely to be protected if something goes wrong. Take 2 minutes to learn more
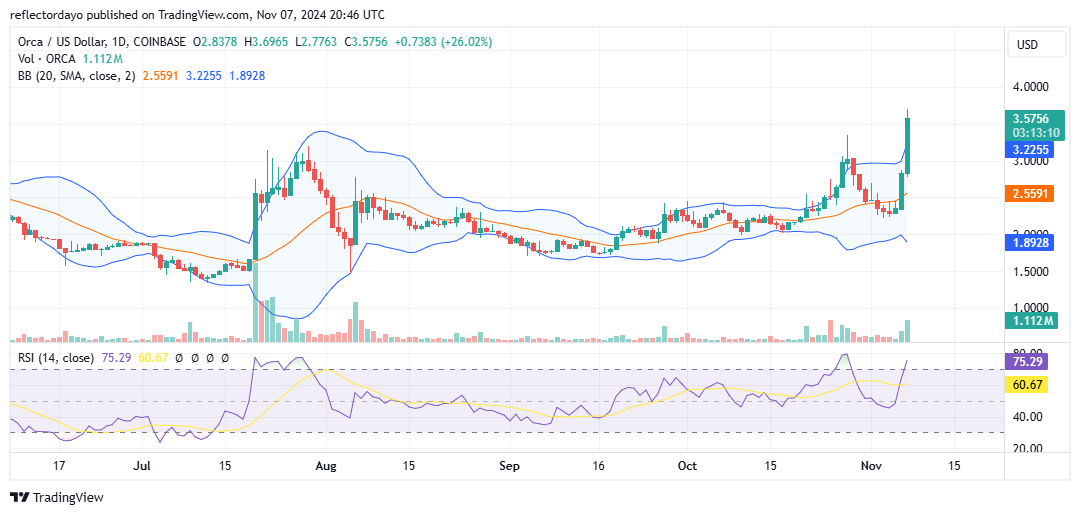
Traders in the Orca market began purchasing at the $1.5 threshold as the last bear market came to an end in July. Shortly afterward, the market experienced heightened volatility due to a surge in bullish optimism, resulting in a rapid price increase within a few days. This led to the establishment of a resistance level at $3.00. Since then, price movements have remained below this resistance. Another attempt to break above the $3.00 level occurred toward the end of October, but it failed to result in sustained price action above this threshold.
Orca Market Data
- ORCA/USD Price Now: $3.60
- ORCA/USD Market Cap: $189 million
- ORCA/USD Circulating Supply: 52.8 million
- ORCA/USD Total Supply: 100 million
- ORCA/USD CoinMarketCap Ranking: #251
Key Levels
- Resistance: $4.00, $4.50, and $5.00
- Support: $3.00, $2.50, and $2.00.
The Orca Market Through the Lens of Indicators
Since early July, when bulls established solid support at the $1.50 level, they have systematically pushed the market toward the critical $3.00 resistance. Following the formation of a higher support level at $2.50 in early November, the market experienced a sharp surge beginning yesterday, with bulls successfully breaking the $3.00 level and pushing the price up to a peak of $3.70. The price action now seeks to establish higher support around $3.50. However, this is unlikely due to overbought conditions indicated by several metrics. The divergence in the Bollinger Bands, along with bullish candlesticks extending above the upper shadow, signals an overbought state of this crypto market. Additionally, the RSI is currently reading above 70, further suggesting overbought conditions. Historically, such intense bullish momentum often precedes a strong correction.
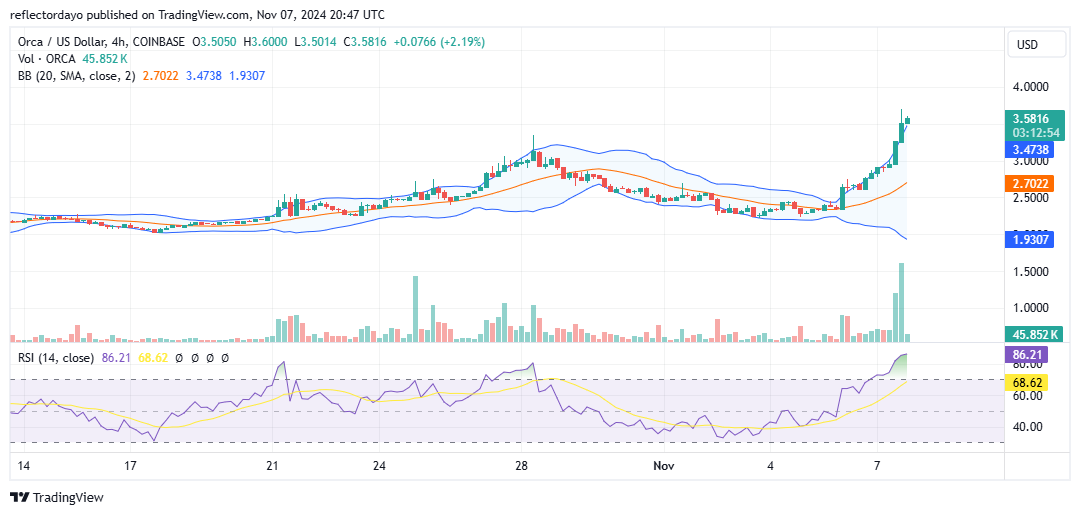
ORCA/USD Price Prediction: 4-Hour Chart Analysis
The 4-hour chart also reflects a similar narrative, showing that bullish momentum has driven the market to a point where a significant correction could be triggered by bearish activity. The chart indicates that bullish momentum is beginning to wane as the market enters overbought territory, suggesting a likely correction ahead. When this correction occurs, the $3.00 level is expected to serve as a potential re-entry point for bulls in the market.