Lucky Block (LBLOCK): Is This the Beginning of a Massive Bull Run?
Estimated Reading Time: 3 minutes
Don’t invest unless you’re prepared to lose all the money you invest. This is a high-risk investment and you are unlikely to be protected if something goes wrong. Take 2 minutes to learn more

Lucky Block (LBLOCK) has surged recently, with the price currently trading around $0.00002012, representing a 10.25% increase. The market outlook remains optimistic, as key technical indicators show signs of sustained upward momentum. Both the daily and 4-hour charts suggest that LBLOCK is preparing for potential resistance testing and further gains.
Daily Chart Analysis of Lucky Block
The daily chart shows LBLOCK trading above the middle Bollinger Band, reflecting strong buying interest. The Bollinger Bands are widening, which often indicates increasing volatility. Key support levels are located around $0.00001850, while resistance stands at $0.00002794.
If buying pressure remains strong, LBLOCK could push further towards the upper band near the $0.00002500-$0.00002794 range.
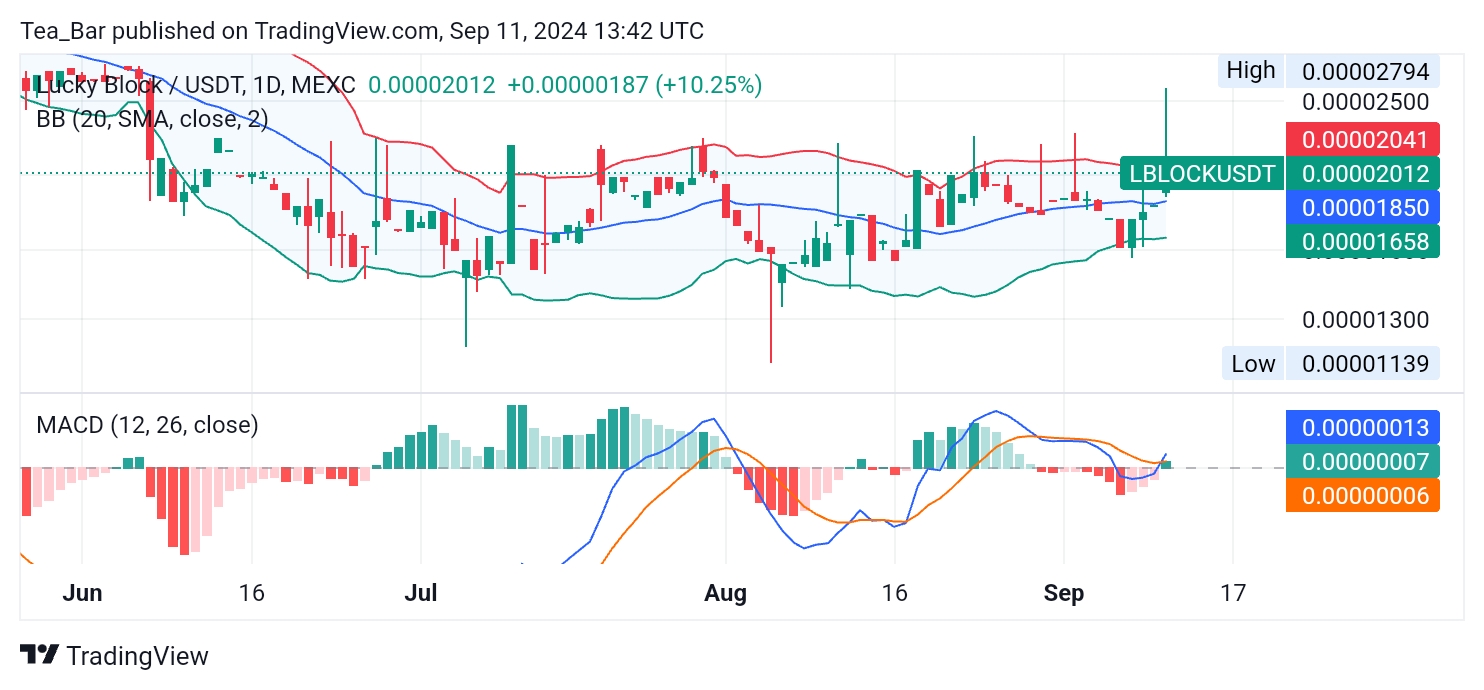
The MACD indicator on the daily chart has confirmed a bullish crossover. The rising histogram bars indicate that the bullish momentum is strengthening, suggesting LBLOCK may retest recent highs and potentially surpass key resistance levels.
4-Hour Chart Analysis
On the 4-hour chart, LBLOCK is also exhibiting a bullish pattern. The price is hovering around $0.00002012, with support at $0.00001771 and resistance at $0.00002600. The Bollinger Bands have expanded, indicating that the market is poised for a more significant move. As long as LBLOCK remains above the support levels, it has a clear path towards retesting the $0.00002500 zone.
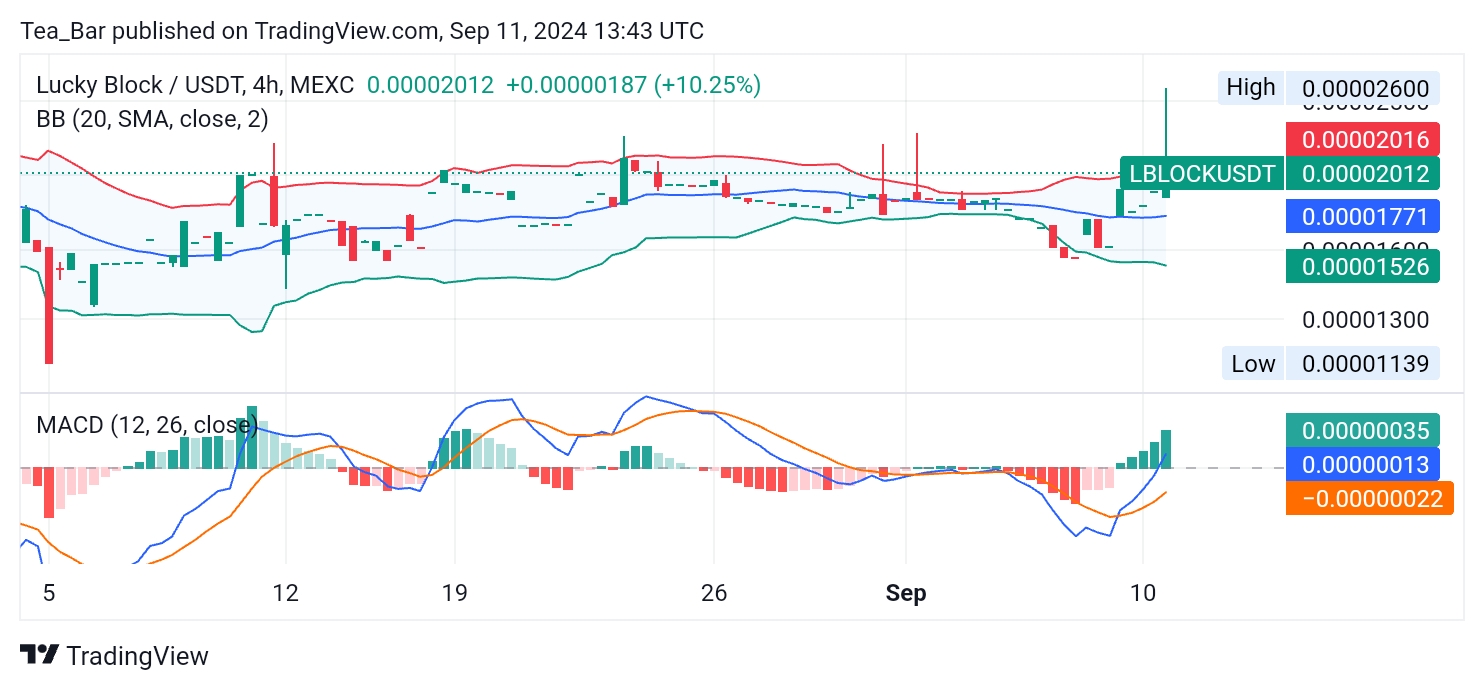
The MACD on the 4-hour chart shows decreasing bearish momentum, with a potential crossover to the upside. This alignment with the daily chart signals continued bullish pressure, increasing the likelihood of a breakout.
Conclusion
Lucky Block (LBLOCK) continues to show strong bullish signals, with both the daily and 4-hour charts indicating a potential breakout. Traders should monitor resistance levels at $0.00002500 and $0.00002794. A successful breach of these levels could lead to further upward movement, making LBLOCK an asset to watch in the coming days.
You can purchase Lucky Block here. Buy LBLOCK.