Litecoin (LTC/USD) Trade Finds Support at $60
Estimated Reading Time: 3 minutes
Don’t invest unless you’re prepared to lose all the money you invest. This is a high-risk investment and you are unlikely to be protected if something goes wrong. Take 2 minutes to learn more
Litecoin Price Prediction – December 20
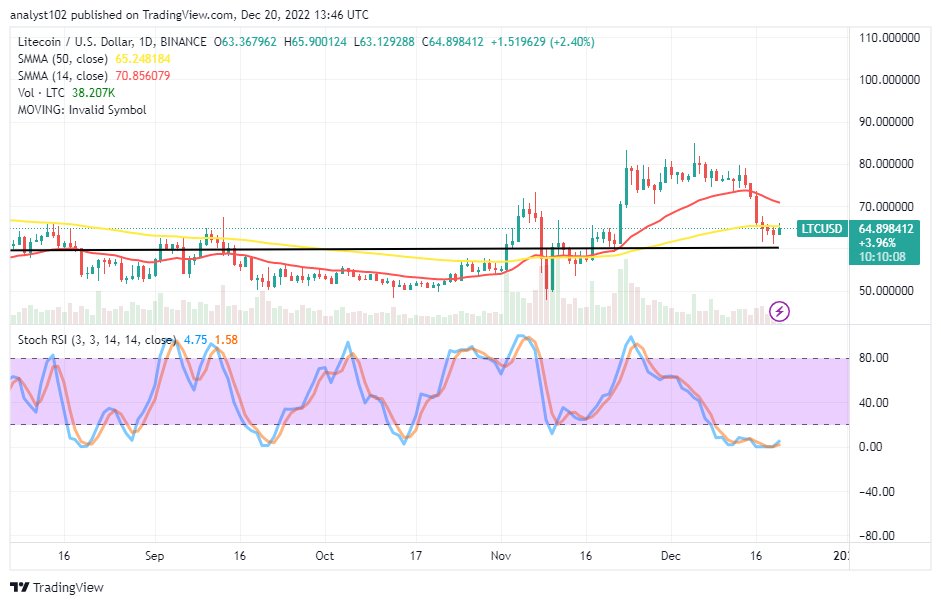
There have been further slight corrections deepening in the LTC/USD market operations as the crypto trade finds support around $60. As of this technical analysis, prices fluctuated between $65.900124 and $63.129288, maintaining a positive percentage rate of 2.40.
LTC/USD Market
Key Levels:
Resistance levels: $70, $75, $80
Support levels: $60, $55, $50
LTC/USD – Daily Chart
The LTC/USD daily chart reveals that the crypto trade finds support around the $60 level after a chain of retracement motions. The horizontal line drawn at the point allows ascertaining the critical potency trading spot that the price needs to breach southward past to affirm the continuation of a bearish-trending move. The 14-day SMA indicator is at $70.86 above the $65.25 value line of the 50-day SMA indicator. The Stochastic Oscillators are seen in the oversold region, attempting to c cross northbound at 1.58 and 4.775 levels.
Is there any evidence that the LTC/USD market may continue to trend downward?
The only supportive indication suggesting that the LTC/USD market may move further in a downward direction is the positioning of the 14-day SMA over the bigger SMA as crypto trade finds support around the $60 level during yesterday’s cycle. Even as there has been a slight sign of bullish momentum gathering sign between the 50-day SMA and the horizontal line drawn at $60, buyers have to be wary of executing a fresh order without considering the presence of active price action.
It has been that the LTC/USD market activities lack the required gravitational weight to visibly make moves through some lower supports beyond $60 in the near time. Fresh shorting orders may not stand the buying strategies near the 50-day SMA indicator’s value. Because of this, traders who want to go short might need to put the practice on hold until the market produces false surges at or between the $70 and $80 value lines before opting to re-launch a sell order.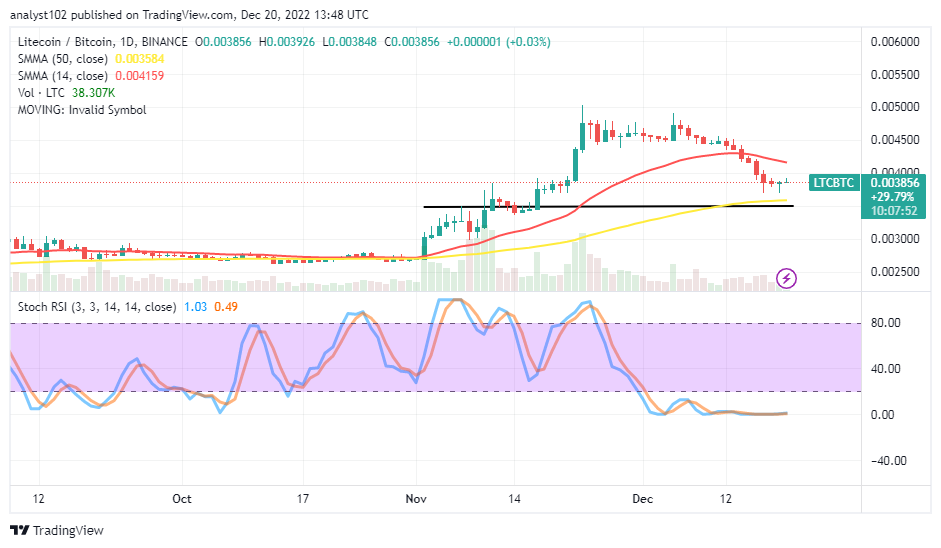
LTC/BTC Price Analysis
In comparison, there has been a sluggish-moving mode in Litecoin’s valuation against Bitcoin. The cryptocurrency pair market finds support near the bigger trend line. The 14-day SMA indicator is above the 50-day SMA indicator. The Stochastic Oscillators have conjoined their lines to move in a consolidation manner around the zero level tightly to indicate the debase-moving style in the LTC market is yet to be over pairing with BTC.
Note: Cryptosignals.org is not a financial advisor. Do your research before investing your funds in any financial asset or presented product or event. We are not responsible for your investing results.
You can purchase Lucky Block here. Buy LBLOCK